
This article details the PASOE Information panel found in ProTop Real-Time.
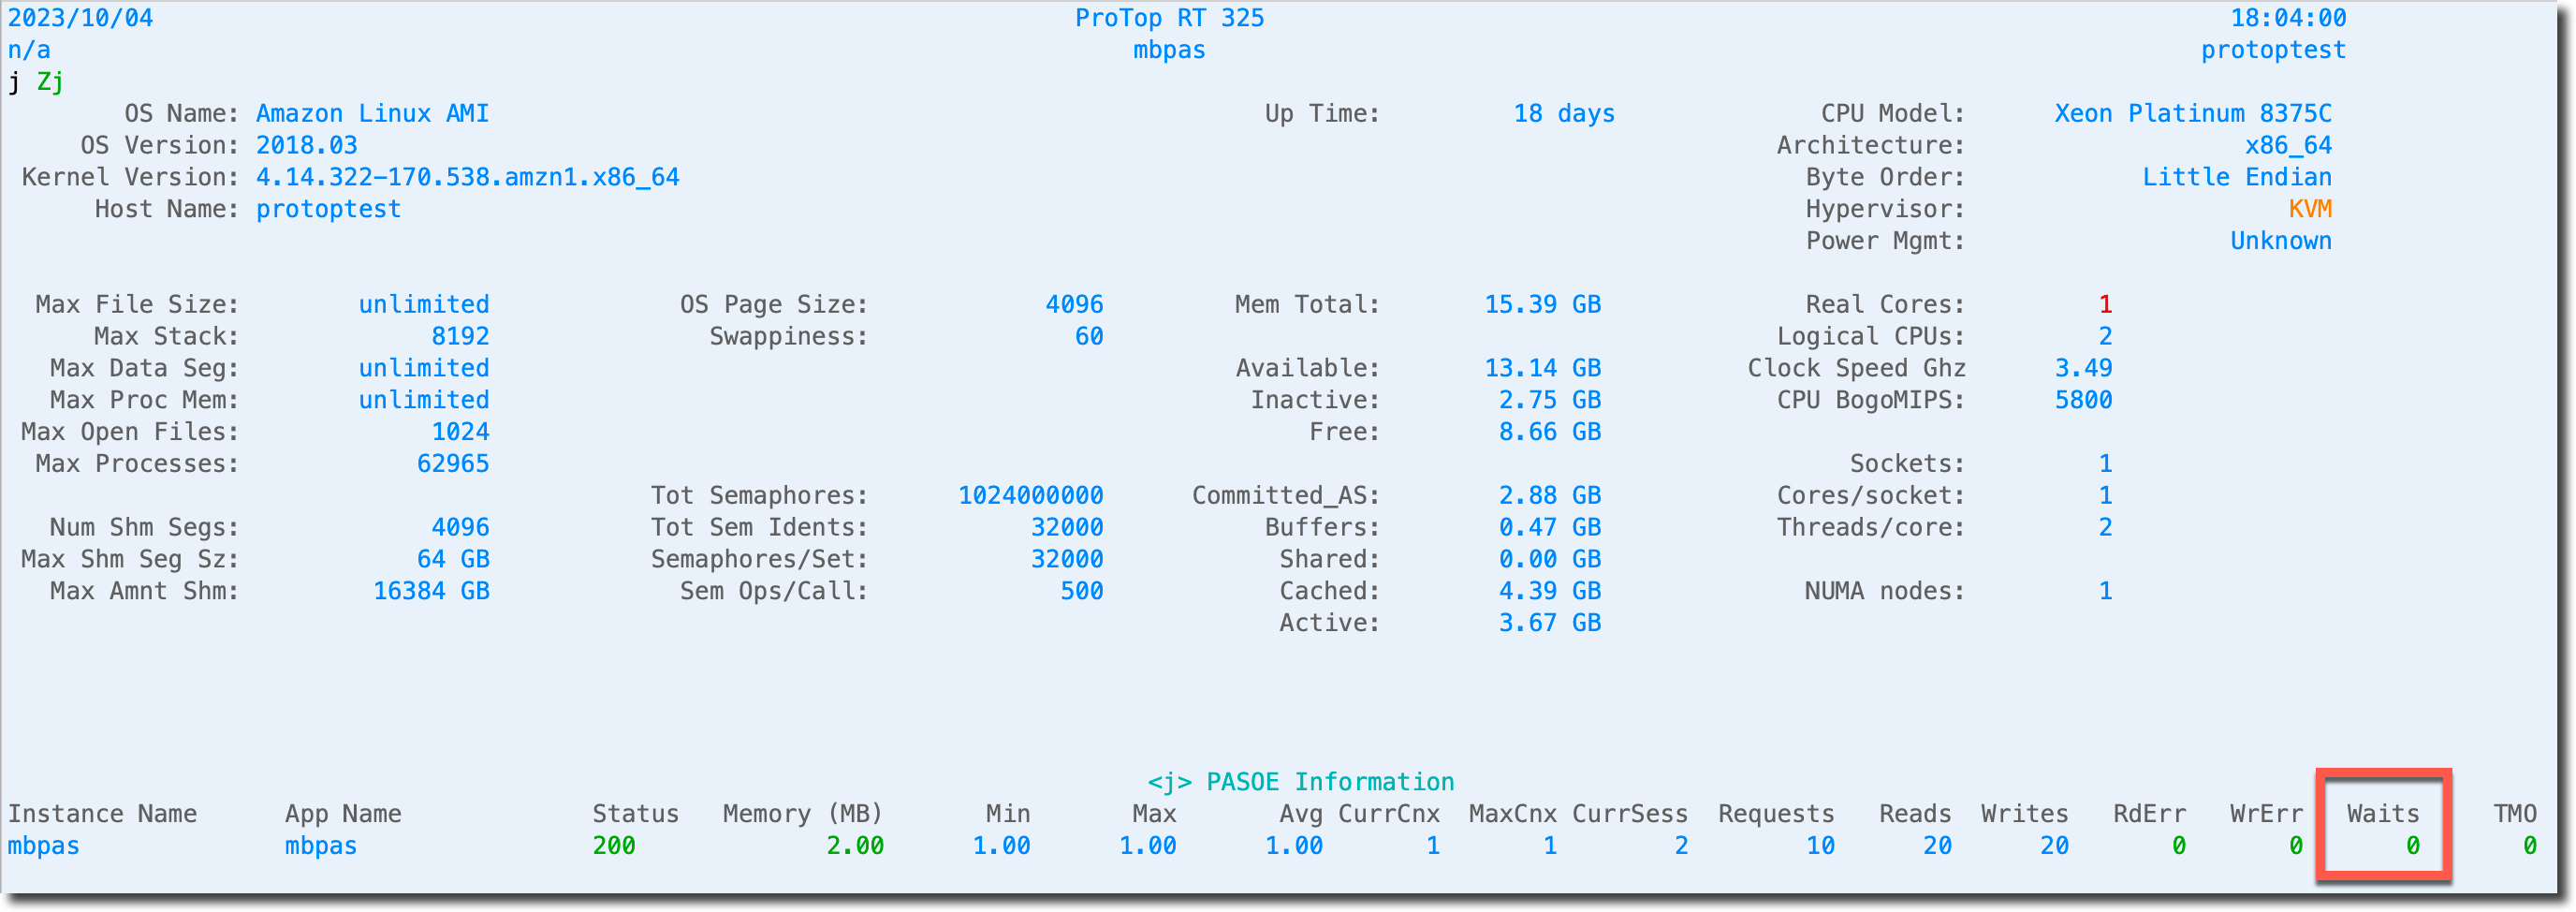
| ProTop RT Label | Alertable Metric* | Description |
| Instance Name | Name of the PASOE instance | |
| App Name | Name of the PASOE-based application | |
| Status | appStatus | <> 200 means the instance is not responding as configured |
| Memory (MB) | memoryUse | MB of Memory in use by this App |
| Min | memSessMin | minimum memory used by a session |
| Max | memSessMax | maximum memory used by a session |
| Ave | memSessAvg | average memory used by a session |
| CurrCnx | currCnx | counter; current connections to the database(s) |
| MaxCnx | maxCnx | counter; reset when the instance restarts |
| CurrSess | currSessions | counter; current sessions |
| Requests | requests | per second |
| Reads | reads | per second |
| Writes | writes | per second |
| RdErr | rdErr | counter; read errors |
| WrErr | wrErr | counter; write errors |
| Waits | waits | Number of waits encountered while reserving a local ABL session |
| TMO | timeOuts | Number of timeouts encountered while reserving a local ABL session |
*Requires data collector "pasoeInfo" in pt3agent.cfg. With the commercial version of ProTop, you can configure alerts using the metric names in this column. For a full list of metrics, see the Alertable Metrics section.