
run profiler on this session (y)
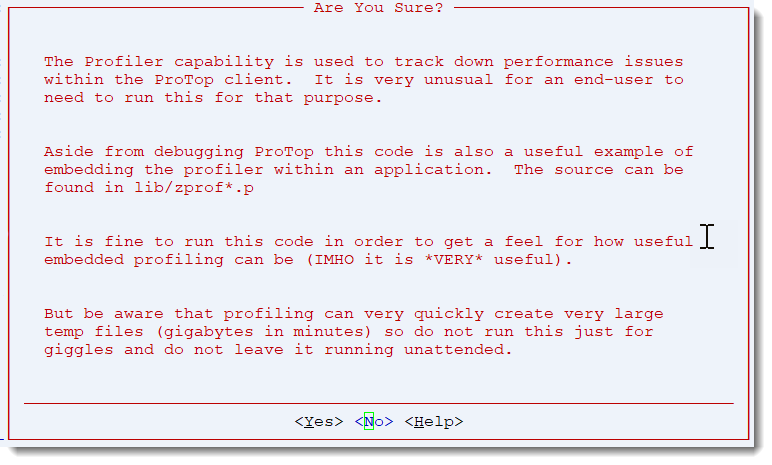
This screen and the accompanying programs (lib/zprof*) are meant to provide an example of how to use the OpenEdge profiler. No useful data related to the attached database is generated.
Please be mindful of the warning below: the profiler can quickly generate gigs of temp file data.
In addition to the "Are You Sure?" window, the following message appears in the lower-left corner of the screen:

Are You Sure
Selecting <Yes> from the "Are You Sure?" screen displays the following screen:
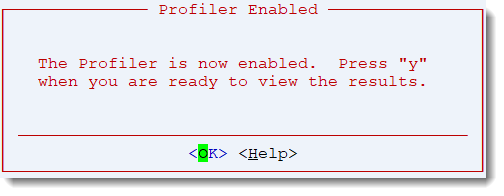
Indicates the profiler is now collecting data
In addition to the "Profiler Enabled" window, the following message appears in the lower-left corner of the screen:

Selecting <No> from the "Are You Sure?" screen returns you to the Dashboard screen
In addition, the following message displays in the lower left corner of the screen:
Selecting <Help>. Ignore if visible (only visible with OpenEdge development license)
Selecting <OK> from the "Profiler Enabled" window returns you to the Dashboard screen.
Selecting <Help> Ignore if visible (only visible with OpenEdge development license)
Displaying Results
When you are ready to stop collecting data and show results, press 'y.' The following window will display:
The following message will appear in the lower-left corner of the screen, displaying how many lines of code were processed during the profiling session:
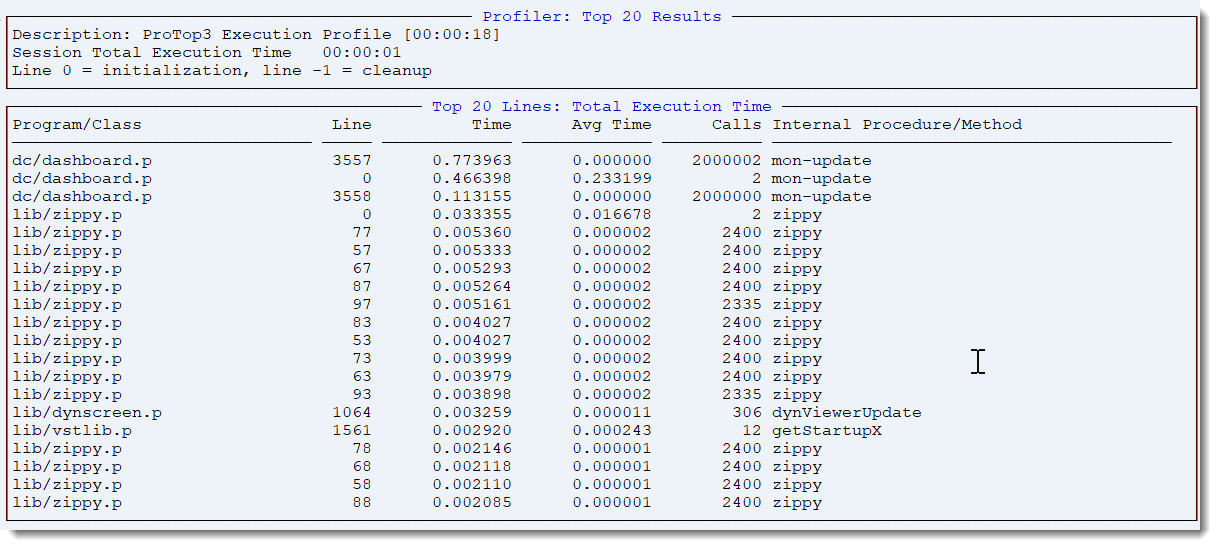
Column Descriptions
| Field | Description |
| Program/Class | The program or class executed |
| Line | Line number in the program |
| Time | Total time spent running the line of code designated above |
| Avg Time | Time averaged by number of calls |
| Calls | Number of calls |
| Internal Procedure/Method | The name of the internal procedure or method being called. By default, this is the program name |
Pressing <spacebar> returns you to the Dashboard panel, with the following message displaying in the lower-left corner of the screen: