
Server usage statistics, memory, CPU, disk, and network I/O, sent to the ProTop Portal by Telegraf and combined visually with your OpenEdge metrics, make for a powerful tool to quickly gain insight into system performance.
What exactly is Telegraf?
Telegraf is a plugin-driven server agent for collecting and sending metrics and events from databases, systems, and IoT sensors to an Influx database anywhere on the internet. Telegraf is written in Go, compiles into a single binary with no external dependencies, and has a very small resource footprint. Nothing is stored locally, and log files are automatically managed. Default values are normally used, but you can change the batch size and sample interval. See Configuration Options for file locations and more. The basic configuration is included below.
Why Telegraf?
Telegraf is installed for most ProTop customers, and we highly recommend it. Having your server and ProTop stats in the same place on the ProTop Portal provides overlapping clues for server resources we don't otherwise have access to, like other monitoring you might be doing.
- ProTop does not alert on your Telegraf data. It is simply a trusted source of resource consumption statistics.
- It provides specifics and trends over time that can inform triage when we are called in to help with performance issues.
- We use it to correlate impacts to the database environment caused by non-database activities on the server.
- We use it to correlate database activity with server resource consumption over time, which can inform capacity planning.
Telegraf vs. ProTop
Telegraf sends server statistics (CPU, Memory, Disk, Network), collected every 10 seconds by default, to the ProTop Portal in batches via HTTP. This time series data is stored in an Influx database. This information is then displayed by the ProTop Portal in the same manner as all of the OpenEdge metrics, making it simple to visually correlate OpenEdge activity with server activity. Visualized server data can be used to isolate when a change occurred and help identify what caused it, be it positive or negative, e.g., firmware update, code deployment, reconfiguring of hardware or software, hardware change, schedule change, etc.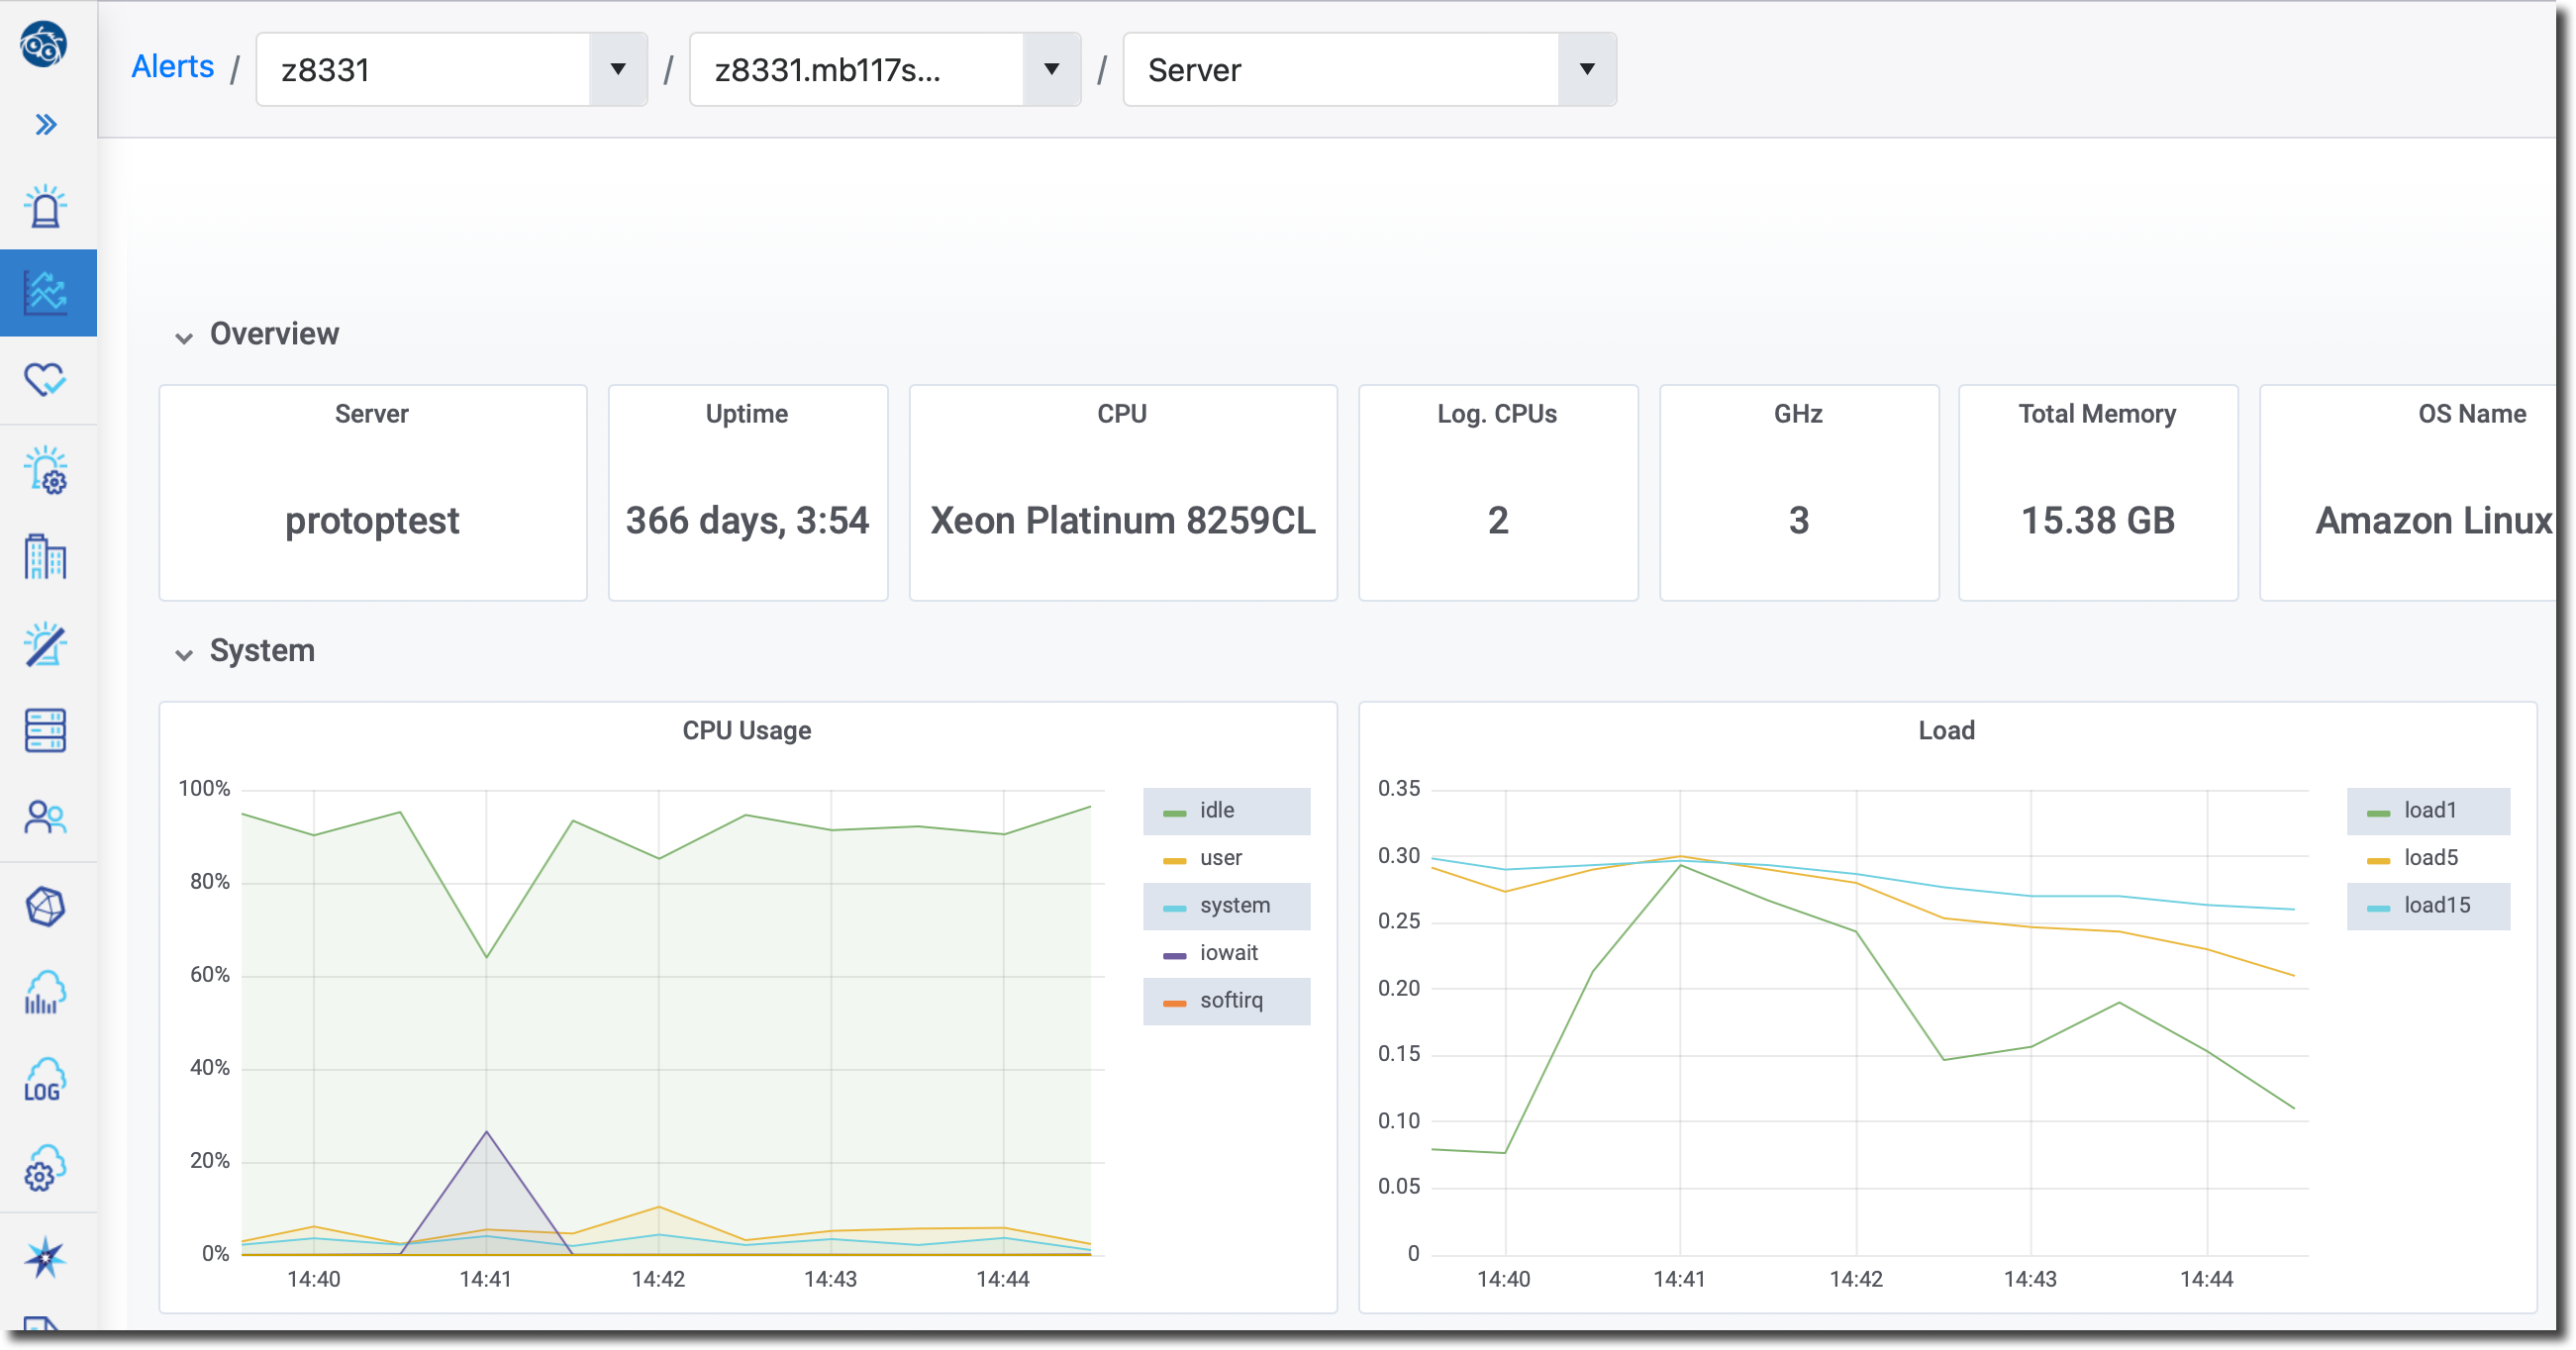
How do I see my server data?
Once you have Telegraf installed and configured and data flows to your ProTop Portal, you can see your Server Metrics in graphical form. Simply:
- Click the Resource name link in the Resources window of the Alerts Dashboard (the first page you see on the portal).
- Click the Trend Data icon from the left side menu in the ProTop Portal, then select your site, resource, and Server option from the dropdowns.
- Or, right-click a resource in the Alerts Dashboard, select Trend Data from the pop-up, and select Server from the dashboard dropdown menu.
A different selection of metrics and graphs will be displayed depending on the Operating System used by the resource.
Telegraf: Installation and Configuration
CENTOS / RHEL
Default installation path: /etc/telegraf
Default log file: /var/log
1. Visit the InfluxDB 2.x Downloads
a. Scroll down to the Telegraf section
b. Choose your platform (package or binaries).
c. The commands to download/install will appear.
d. As root, execute the command on the server you want Telegraf to run on.
2. Edit your configuration file, usually: /etc/telegraf/telegraf.conf
a. Set the Telegraf output URL to send data to the portal influx db, where custid[1|2] in the examples below are customer IDs from your etc/custid.cfg file(s). Use the same domain (e.g., dashboard.wss.com) from the URL you use to log into the portal.
For example, if you log into http://dashboard.wss.com to see your ProTop alerts and trends, and your custid in etc/custid.cfg is custid1, your "urls" variable will look like this:
[[outputs.influxdb]]
  urls = ["http://dashboard.wss.com/data-custid1"]
If you have more than one site (custid) that uses the same server, you can send your Telegraf data to multiple influx databases by creating more than one "urls" line:
[[outputs.influxdb]]b. Uncomment line [[inputs.linux_sysctl_fs]] so that it looks like this:
urls = ["http://dashboard.wss.com/data-custid1"]
[[outputs.influxdb]]
urls = ["http://dashboard.wss.com/data-custid2"]
# # Provides Linux sysctl fs metrics
[[inputs.linux_sysctl_fs]]
c. Uncomment line [[inputs.net]] so that it looks like this:
# # Read metrics about network interface usage
[[inputs.net]]
d. Uncomment and modify the network "interfaces" line. The default network interface is usually "eth0" which would look like this in your telegraf.conf file:
# ## By default, telegraf gathers stats from any up interface (excluding loopback)
# ## Setting interfaces will tell it to gather these explicit interfaces,
# ## regardless of status.
# ##
interfaces = ["eth0"]
3. Set Telegraf to autostart after a reboot:
$ service telegraf enable (or: systemctl enable telegraf for systemd)
4. Start Telegraf:
$ service telegraf start (or: systemctl start telegraf for systemd)
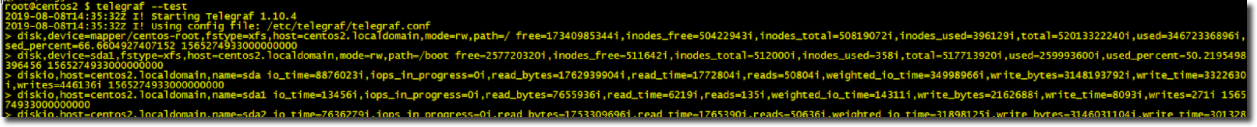
5. Execute the following command to test your configuration:
$ telegraf --test
The output should display something similar to the following:
6. Logging. Unless you override the settings, log files on *nix are maintained in /var/log. On Windows, they go to the event log. To set custom values for your log files, edit your /etc/telegraf/telegraf.conf file, search for "logtarget," and set and uncomment the following values according to your preferences:
a. logtarget = "file" - controls the destination for logs and can be one of "file", "stderr" or, on Windows, "eventlog". When set to "file," the output file is determined by the "logfile" setting.
b. logfile = "" - Name of the file to be logged to when using the "file" logtarget. If set to the empty string, then logs are written to stderr.
c. logfile_rotation_interval = 1d (e.g, rotate once a day) - The log file will be rotated after the specified time interval. When set to 0, no time-based rotation is performed. Logs are rotated only when written to. If there is no log activity, rotation may be delayed.
d. logfile_rotation_max_size = 25MB (example size) - The log file will be rotated when it becomes larger than the specified size. When set to 0, no size-based rotation is performed.
e. logfile_rotation_max_archive = 6 (example value) - Maximum number of rotated archives to keep; any older logs are deleted. If set to -1, no archives are removed.
WINDOWS
Default installation path: c:\Program Files\telegraf
Default configuration file: c:\Program Files\telegraf\telegraf.conf
1. Download the appropriate Telegraf package for your Windows server. The package contains the binary and the configuration file.
2. Create the directory c:\Program Files\telegraf
3. Double-click the downloaded file and Extract all to C:\Program Files\telegraf. This will create a new folder containing the executable and configuration files for the downloaded version. Move the executable in that new folder up one level so it is in c:\Program Files\telegraf. Leave the conf file where it is for future reference.
4. Copy and paste the following minimal Windows Telegraf config into c:\Program Files\telegraf\telegraf.conf:
# Telegraf Configuration example for v1.24.2
#
[global_tags]
[agent]
interval = "10s"
round_interval = true
metric_batch_size = 1000
metric_buffer_limit = 10000
collection_jitter = "0s"
flush_interval = "10s"
flush_jitter = "0s"
precision = "0s"
# logtarget = "file"
# logfile = ""
# logfile_rotation_interval = "0h"
# logfile_rotation_max_size = "0MB"
# logfile_rotation_max_archives = 5
hostname = ""
omit_hostname = false
[[outputs.influxdb]]
urls = ["http://demo.wss.com/data-z8331"]
[[inputs.mem]]
[[inputs.processes]]
[[inputs.swap]]
[[inputs.system]]
[[inputs.win_perf_counters.object]]
# Processor usage, alternative to native, reports on a per core.
ObjectName = "Processor"
Instances = ["*"]
Counters = [
"% Idle Time",
"% Interrupt Time",
"% Privileged Time",
"% User Time",
"% Processor Time",
"% DPC Time",
]
Measurement = "win_cpu"
# Set to true to include _Total instance when querying for all (*).
# IncludeTotal=false
# Print out when the performance counter is missing from object, counter or instance.
# WarnOnMissing = false
# Gather raw values instead of formatted. Raw value is stored in the field name with the "_Raw" suffix, e.g. "Disk_Read_Bytes_sec_Raw".
# UseRawValues = true
[[inputs.win_perf_counters.object]]
# Disk times and queues
ObjectName = "LogicalDisk"
Instances = ["*"]
Counters = [
"% Idle Time",
"% Disk Time",
"% Disk Read Time",
"% Disk Write Time",
"% User Time",
"% Free Space",
"Current Disk Queue Length",
"Free Megabytes",
]
Measurement = "win_disk"
[[inputs.win_perf_counters.object]]
ObjectName = "PhysicalDisk"
Instances = ["*"]
Counters = [
"Disk Read Bytes/sec",
"Disk Write Bytes/sec",
"Current Disk Queue Length",
"Disk Reads/sec",
"Disk Writes/sec",
"% Disk Time",
"% Disk Read Time",
"% Disk Write Time",
]
Measurement = "win_diskio"
[[inputs.win_perf_counters.object]]
ObjectName = "Network Interface"
Instances = ["*"]
Counters = [
"Bytes Received/sec",
"Bytes Sent/sec",
"Packets Received/sec",
"Packets Sent/sec",
"Packets Received Discarded",
"Packets Outbound Discarded",
"Packets Received Errors",
"Packets Outbound Errors",
]
Measurement = "win_net"
[[inputs.win_perf_counters.object]]
ObjectName = "System"
Counters = [
"Context Switches/sec",
"System Calls/sec",
"Processor Queue Length",
"System Up Time",
]
Instances = ["------"]
Measurement = "win_system"
[[inputs.win_perf_counters.object]]
# Example counterPath where the Instance portion must be removed to get data back,
# such as from the Memory object.
ObjectName = "Memory"
Counters = [
"Available Bytes",
"Cache Faults/sec",
"Demand Zero Faults/sec",
"Page Faults/sec",
"Pages/sec",
"Transition Faults/sec",
"Pool Nonpaged Bytes",
"Pool Paged Bytes",
"Standby Cache Reserve Bytes",
"Standby Cache Normal Priority Bytes",
"Standby Cache Core Bytes",
]
Instances = ["------"] # Use 6 x - to remove the Instance bit from the counterPath.
Measurement = "win_mem"
[[inputs.win_perf_counters.object]]
# Example query where the Instance portion must be removed to get data back,
# such as from the Paging File object.
ObjectName = "Paging File"
Counters = [
"% Usage",
]
Instances = ["_Total"]
Measurement = "win_swap"
5. Set the Telegraf outputs.influxdb "urls" to send data to your portal influx db. Where custid1-2 in the examples below are customer IDs from your etc/custid.cfg, be sure to use the domain from your URL (e.g., dashboard.wss.com) to log into the ProTop portal.
For example, if you log into http://dashboard.wss.com to see your ProTop alerts and trends, and your custid in etc/custid.cfg is custid1, your "urls" variable will look like this:
[[outputs.influxdb]]
urls = ["http://dashboard.wss.com/data-custid1"]
If you have more than one site (custid) that uses the same server, you can send your Telegraf data to multiple influx databases by creating more than one "urls" line:
[[outputs.influxdb]]
  urls = ["http://dashboard.wss.com/data-custid1"]
[[outputs.influxdb]]
  urls = ["http://dashboard.wss.com/data-custid2"]
6. Start a Windows Command Prompt as an Administrator
7. Install Telegraf as a Service
C:> cd C:\Program Files\telegraf
C:> telegraf.exe --config "C:\Program files\telegraf\telegraf.conf" --service install
NOTE: always specify the explicit config file location using --config and double quote it if it contains spaces.
8. Start Telegraf:
C:\> net start telegraf
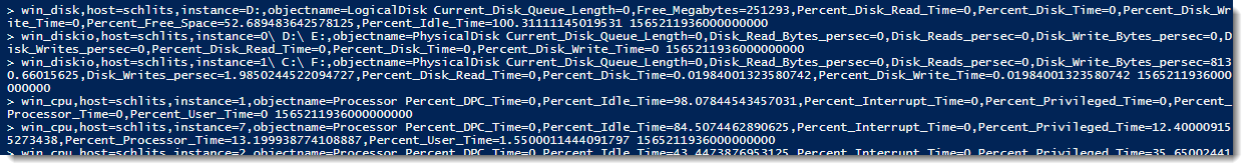
9. Execute the following commands to test your configuration:
C:> cd C:\Program Files\telegraf
C:> telegraf.exe --test --config "C:\Program Files\telegraf\telegraf.conf"
The output should display something similar to the following:
Want to ignore certain file systems?
Use
Troubleshooting Telegraf: Linux and Windows
If Telegraf is properly configured, server metrics should be displayed on ProTop’s portal ~5 minutes after the Telegraf service is started. If no metrics are displayed, check your Telegraf log.
LOGS
For Linux, see /var/log/telegraf.log. If not there, look for custom settings in your /etc/telegraf/telegraf.conf file. When Telegraf runs as a Windows service, Telegraf logs messages to Windows event logs by default. If the Telegraf service fails to start, view error logs by selecting Event Viewer→Windows Logs→Application. You can override the default logging by following the instructions above.
Common Issue 1: Wrong "urls"
Error: 2019-08-09T18:55:41Z I! [agent] Config: Interval:10s, Quiet:false, Hostname:"[server]", Flush Interval:10s 2019-08-09T19:59:55Z E! [outputs.influxdb] when writing to [http://portal.wss.com/data-]: Post http://portal.wss.com/data-[site]/write?db=telegraf: net/http: request canceled (Client.Timeout exceeded while awaiting headers)
Problem: Data is being sent to the wrong URL, which does contain the "data-custid" listed.
Solution: Edit the config file and be sure the URL is set correctly:
Demo Portal Example:
http://demo.wss.com/data-custid or https://demo.wss.com/data-custid
Dashboard Portal Example:
http://dashboard.wss.com/data-custid or https://dashboard.wss.com/data-custid
Europe Portal Example:
http://dashboard.protop-europe.com/data-custid or https://dashboard.protop-europe.com/data-custid
Common Issue 2: database "telegraf" creation failed
Error: 2022-02-07T21:08:28Z W! [outputs.influxdb] When writing to [http://dashboard.wss.com/data-telegraf/]: database "telegraf" creation failed: 403 Forbidden
Problem: Telegraf tries to create the database on startup by default as a convenience for those without authentication enabled in InfluxDB.
Solution: Ignore
Common Issue 3: Windows server data not showing up in the portal
1. Edit your telegraf.conf and uncomment all sections that include references to "win_" . For Telegraf v1.22.0, these lines are found between lines 6967 and 7113. Please don't uncomment all of them; some are comments, and some are options, so only remove the # at the start of the line.
We have had success by uncommenting these lines:
6968, 6988, 6996-7113
2. Restart the service, and your server data should appear on the portal.
If all else fails ...
For more help, please reach out to us by using the chat feature on this page or the "Comments?Questions?" link at the top right of this page. We will do our best to respond within one business day.