
Table Activity (t)
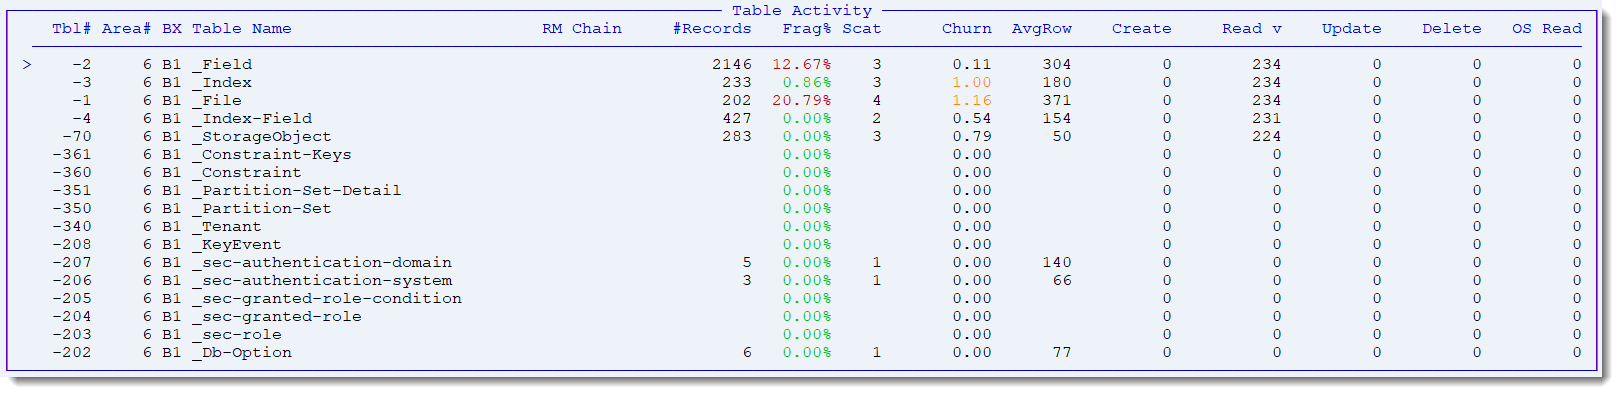
This panel shows detailed table activity for all tables being monitored, based on your table and index range parameter settings. By default, only the first 50 application tables and indexes are monitored. See Table and Index Range Information (T) for more information and suggested values.
| ProTop RT Label | Alertable Metric | Description |
| Tbl# | tblNum | Unique table ID from Progress schema table _file |
| Area# | tblAreaNum | Database area containing the table |
| BX | tblPool | Blocks assigned to the primary buffer pool (B1) or alternate buffer pool (B2) |
| Table Name | tblName | Name of the table |
| RM Chain | tblRM | Number of blocks in the RM Chain. Requires DB Analysis file in $PROTOP/dbanalys/friendlyName.dba |
| #Records | dbaRecs | Number of records in a table. Requires DB Analysis file in $PROTOP/dbanalys/friendlyName.dba |
| Frag% | dbaFragPct | The degree of record fragmentation for each table. |
| Scat | dbaScatter | The degree of distance between records in the table. |
| Churn | tblTurn | The ratio of record reads to the number of records in that table. For example, a table with 100 records read 1000 times per second would have a churn of 10. |
| AvgRow | dbaAvgRow | Average row(record) size |
| Create | tblCr | Number of records created |
| Read | tblRd | Number of records read |
| Update | tblUp | Number of records updated |
| Delete | tblDl | Number of records deleted |
| OS Reads | tblOSRd | Number of operating system reads |
*Requires data collector "TableActivity" in pt3agent.cfg. With the commercial version of ProTop, you can configure alerts using the metric names in this column. For a full list of metrics, see the Alertable Metrics section.
Insight into Table Activity
Fragmentation %: Normally, we expect a record to exist in one data block. However, if the record size is too large, or if the record grows such that it no longer fits in the block, the excess data is stored in another block and the record is considered fragmented.
The recommendation to dump and reload the table because of fragmentation depends on a number of factors: how big is the table and how fragmented is it?
Dumping and reloading will improve disk space usage and performance, but you may need to adjust create and toss limits for the storage area.
Scatter Factor: For type 1 areas it is a measure of how well the data fits into the minimum # of blocks that would be required to hold it with “distance” between blocks taken into account. For type 2 areas there is no distance penalty – but free space in a cluster can increase scatter. In both cases, this is a measure of physical scatter.
This Scatter Factor should not be confused with Logical Scatter, the probability that records in a given logical order are also in “physical” order (in the same block). Each index has its own ordering and thus its own logical scatter.
Churn: This very important metric highlights why it is very important for ProTop to have access to a recent DB Analysis. If ProTop is telling you that you are reading 100K records per second out of table xyz, is that a lot? If table xyz only has 100 records, then the answer is a resounding YES!! But if table xyz has 100M records, then 100K reads/sec is maybe not abnormal. ProTop excels at pointing out these abnormalities.
Another important point: Excessive churn does not necessarily imply that “full table scans” are taking place – it could just as easily be a single record read over and over and over. Look at the BF1 - BF4 latch activity: if they seem fairly balanced then you are likely reading a wide number of records. If one of these latches stands out significantly, then you are likely reading a small number of records over and over again.