
User IO Activity (u)
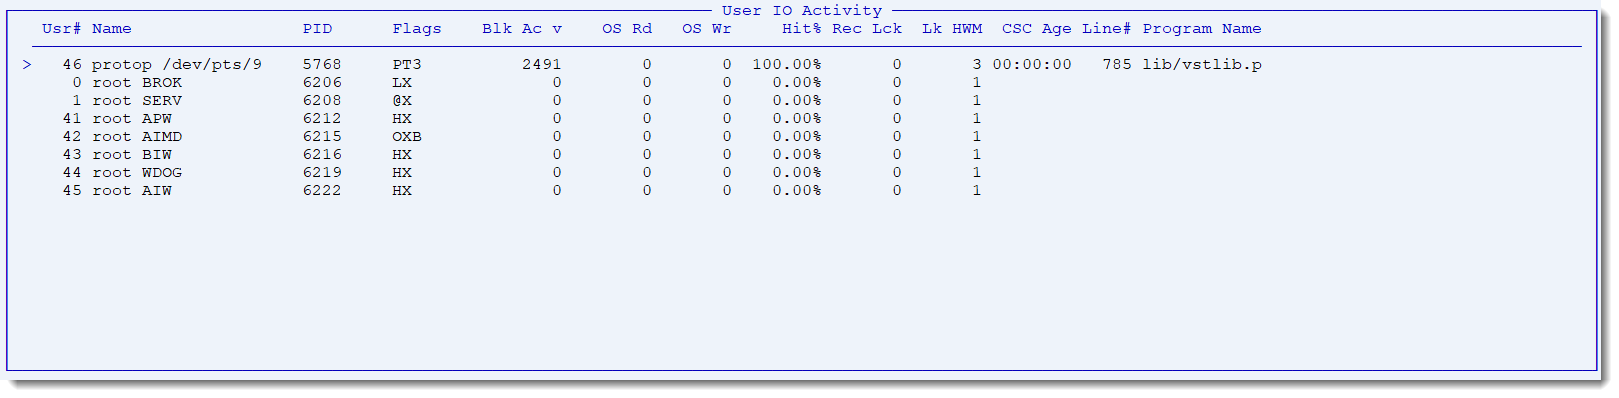
Display IO activity by user.
| ProTop RT Label | Alertable Metric* | Description |
| Usr# | usrNum | Unique user number |
| Name | usrName | User login name |
| PID | userPID | Operating System process id |
| Flags | userFlags | See table below |
| Blk Ac | dbAccess | Number of database blocks accessed, both reads and writes |
| OS Rd | OSReads | Number of operating system reads |
| OS Wr | OSWrites | Number of operating system writes |
| Hit % | hitRatio | Percentage of database reads from database buffer cache |
| Rec Lck | recLks | Number of record locks |
| Lck HWM | lkHWM | Lock table concurrent locks high water mark |
| CSC Age | lastUpd | If enabled, the number of seconds since the user's Client Statement Cache (CSC) was last updated |
| Line# | lineNum | If client statement cache is enabled, the line number of the currently executing program |
| Program Name | procName | If client statement cache is enabled, the name of the program that is currently executing |
*Requires data collector "UserIOActivity" in pt3agent.cfg. With the commercial version of ProTop, you can configure alerts using the metric names in this column. For a full list of metrics, see the Alertable Metrics section.
Flag values
| Flag | Description |
| S | Shared memory client |
| R | Remote client |
| L | Login broker |
| @ | Server |
| H | helper |
| O | Other |
| 4 | 4GL Client |
| W | Webspeed client |
| B | Batch client |
| A | Application server |
| P | PASOE |
| Q | SQL |
| X | Unknown |
| * | Transaction active |
| d | Disconnecting |
| r | Undo or error |
| I | STOP or Ctrl-c |
| N- | Notification pending |
| -N | Notification in process |
| NN | Notification pending and in process |