Example alert from the ProTop Portal: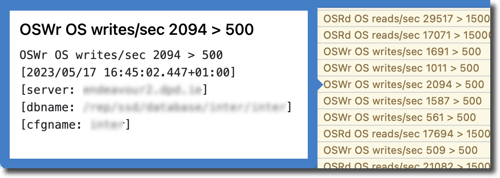
What does it mean?
Your database is writing to the file system at an elevated level, possibly consuming significant disk space. This might be caused by:
- a schema change to a fast-growing table assigned to an area with low RPB
- writing to a pre-allocated (fixed) extent (not consuming new disk space)
- updating existing data
- reusing bi clusters
What to do?
Check the OS Write trends for this database in ProTop Portal Trends: Advanced Dashboard > Database I/O row, DB Writes graph > OS Writes in the legend.
Is this current level of writes normal? If not, fire up ProTop RT and look at the "u" panel (User IO Activity). It includes OS Writes (OSWr) per second for all connected sessions.
If the culprit is not immediately discernable, hide the other panels (press the key in parens in the panel title) and/or use the ^ command key to sort by OSWr descending to see which session performs the most OS writes and investigate.
To see exactly what code the high OSWr session is running, use the "#" key and enter the user number of the highest OSWr session. Enter a 1 and press enter. The code might now (or soon) be listed in the "u" panel to the far right. Or you can use the "U" command to see a complete picture of what that session is up to.
Check your variable extents; are any growing rapidly due to a schema change?
If all else fails...
Contact us at support@wss.com or use the online chat. We'll be happy to help.