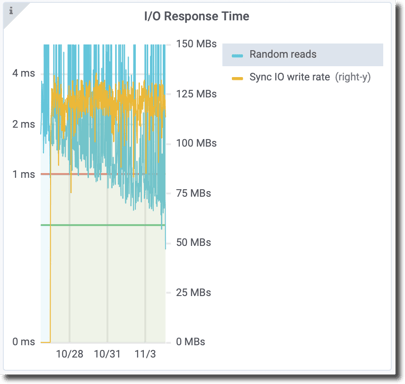
All about Random reads (IO Response)
Also known as Random IO (ms) in ProTop RT and found in ProTop Trends Advanced Dashboard under I/O Response. The alertable metric name is ioResponse.
The Random IO metric generally measures the time it takes to perform a random read of a byte from a database file that is (most likely) not already in memory. It is a gross measure of how the OS responds to disk I/O requests. It can shine some light and help distinguish between db and OS issues. The key point is that this is an END-TO-END measure from the application's point of view rather than having to pull together disconnected logs from multiple sources.
Looking at variances in the data over time on the Portal, i.e., what the value is currently versus this system’s typical level, helps answer questions like “why is the application slow/why is the database slow” by identifying that the database or application may be the victim of the same underlying system contention issues that are currently increasing the value of ioResponse.
Note: if you see a metric chart for I/O Response Time where Random reads are getting faster over time:
This behavior is consistent with a very small database and a large buffer pool for which the byte we are reading is increasingly likely to be found in memory. The algorithm for selecting a byte not already in memory is based on more "normal" sized databases. This database is only 510 MB.
Not seeing random reads for a really small database?