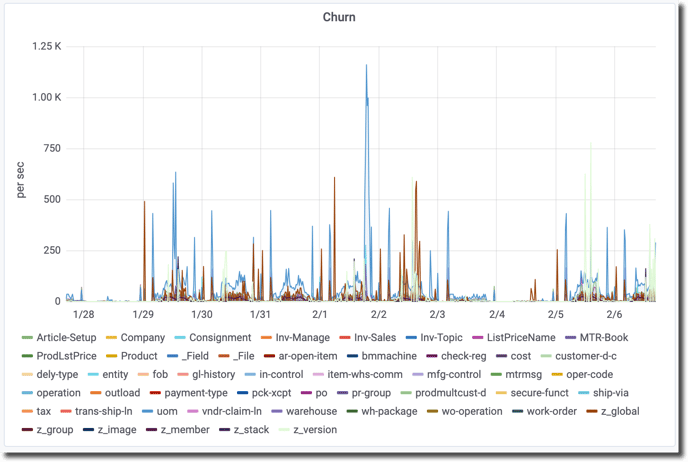
Churn (chart)
I see a chart labeled Churn in the ProTop Portal. What's it about?

The ratio of record reads to the number of records in that table. For instance, a table with 100 records that are being read 1000 times per second would have a churn of 10. This does not necessarily mean that “table scans” are taking place – it could just as easily be a single record being read repeatedly.
This metric is ”per second”.
NOTE: This chart requires a recent database analysis in your $PROTOP/dbanalys directory.