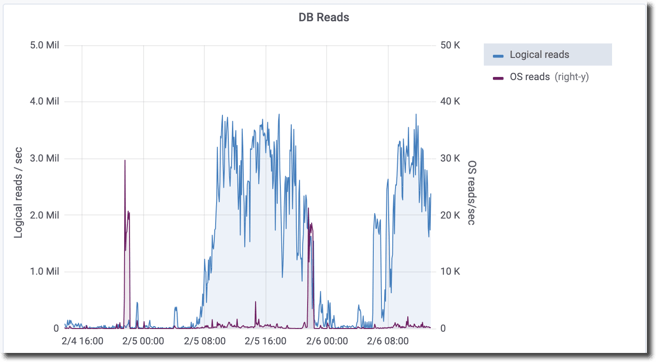
Charts in the ProTop Portal typically include a left and right axis. Which axis applies to which metric can be seen in the legend in the top right of the chart.
In this case, the left axis shows “Logical reads/sec.” These are the read operations required to access data blocks containing a record or an index entry. (There are usually multiple “logical reads” required to satisfy a 4gl request such as a FIND statement.). Logical reads are “block access” operations in the –B buffer cache.
The right axis shows "OS Reads/sec". These occur when a block is not present in the –B buffer cache and must be fetched from the disk.
These metrics are “per second”.