The ProTop portal can tell you when it's happening
By default, the latest version of ProTop sends blocked session alerts to the ProTop portal. They can be your first clue that something is amiss in your application code.
The alert title will look like:![]()
or![]()
The alert details for zBlkDura will look something like this: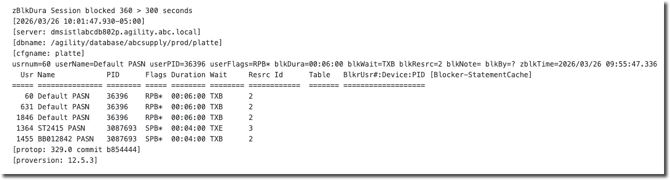
or this for zBlkrQ: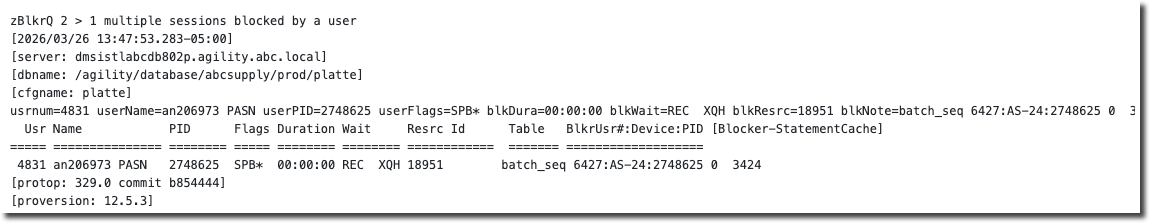
This detailed information is provided by the enhancers in your alert configuration.
These are the default alert definitions that produce the output above:
If you do not see these lines in your localized etc/alert.*.cfg file, update your version of ProTop and copy the lines above from the latest default etc/alert.cfg file into your etc/alert.*.cfg file. The ProTop agents will automatically read the changes and monitor blocked sessions.
If you are using the commercial version of ProTop you can also configure the portal to forward these alerts to a list of recipients as an email or a page (and soon via any Webhook enabled application, Slack, etc).
Use ProTop Real-Time to dive deeper
When you see these alerts in the portal or via email or page, the first thing to do is open ProTop Real-Time (RT) for the site and resource listed and use the command-key "b" to show Blocked Sessions: The Blocked Sessions panel is one of the most insightful screens in ProTop. It shows who is blocking whom, the blocked resource, and indicates if the same user is blocking multiple sessions. Deadly embraces (deadlocks) can be seen here as well.
Is the Blocker a PASOE session?
See this Progress KBase entry on getting a stack trace for PASOE.
Client statement cache tells all
To get at the culprit code, you need to enable the client statement cache (CSC) for the Blocker-Usr# listed in the Blocked Sessions panel, in this case, "7", outlined in red above. You enable it by telling ProTop RT the user number you are interested in. See Set Usr# (#) for more information.
Assuming the blocking session actively talks to the database, it will pick up the request to send its CSC. After a screen refresh or two, you will see the Blocker-StatementCache in the Blocked Sessions panel (outlined in green above). In this case, we know the blocker is on line 17 of s2k_demo/blocker.p. If you have updated your alert configuration, these details arrive at the portal with the blocked session alerts, ready to be examined at your earliest opportunity.
If the CSC data is not populated, use $DLC/bin/proGetStack on the Device: PID (underlined in yellow above) to generate a protrace file. The protrace will include the full ABL call stack, including program names and line numbers, and is found in the session's working directory, not the -T directory. To get a protrace file, you must log on to the same server from which the client is connecting, and you must have root or Administrator privileges (for CSC data, you only need access to the database with DBA privileges).
Examine your code
You should now have enough information about your blocked and blocking sessions to investigate the code. You have the table name (underlined in purple above) and a call stack or at least one procedure name and line number implicated in these blocked sessions. Now it is time to chat with your development team and share the details.
Blocked sessions need not be a silent killer
Your users should not be frustrated waiting for data in your database to free up to do their jobs. ProTop can tell you when blocked, and blocking sessions occur in your database application. It can even guide you to the problem table and the specific line of code causing the problem! Got ProTop?