How do you know when excessive reads might be going in your database?
1. Alerts - here are some examples:
NOTE: It's important to know when excessive reads occur. Suppose they happen during large batch processes in the middle of the night, and your batch processing is completed promptly. In that case, this is likely less of a concern than when users are trying to enter data and are being slowed down while trying to process transactions.
LogRd - logical reads from the database are high. The highest read table is at the top and asking to be investigated: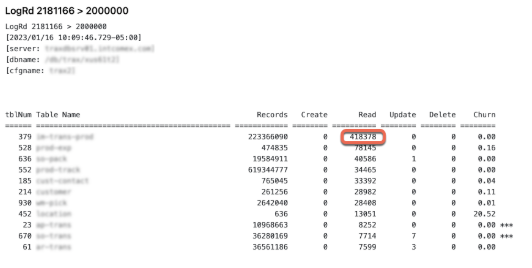
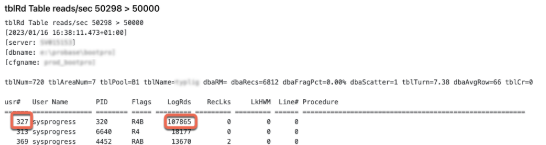
tblRd - reads from a single table exceed the alert threshold, and the user with the most reads is shown:
RecRd - logical reads per second from the database exceed the threshold: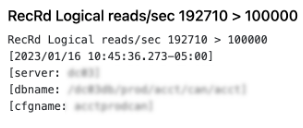
OSRd - OS reads oper second breaches the alert threshold: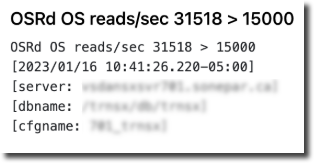
tblTurn - so may reads occur that the entire table (in the top box)could be read this many times per second. We can investigate the Table Name or the "usr#"s listed: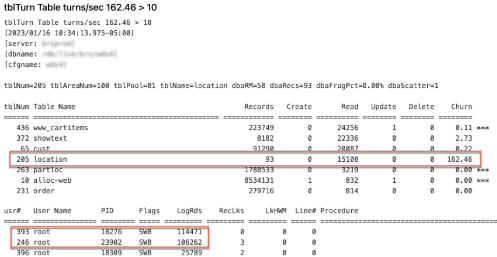
2. Health Checks:
Call out index reads, table reads, and table turns that might indicate unexpected application behavior: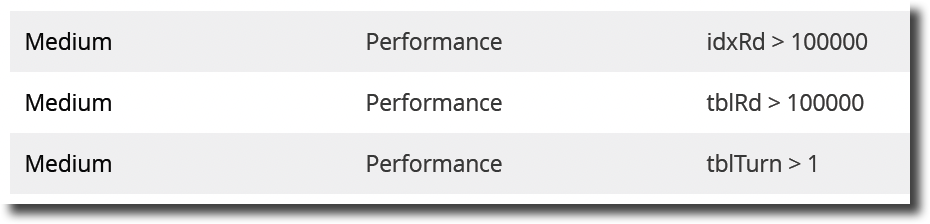
And the object names are most often included: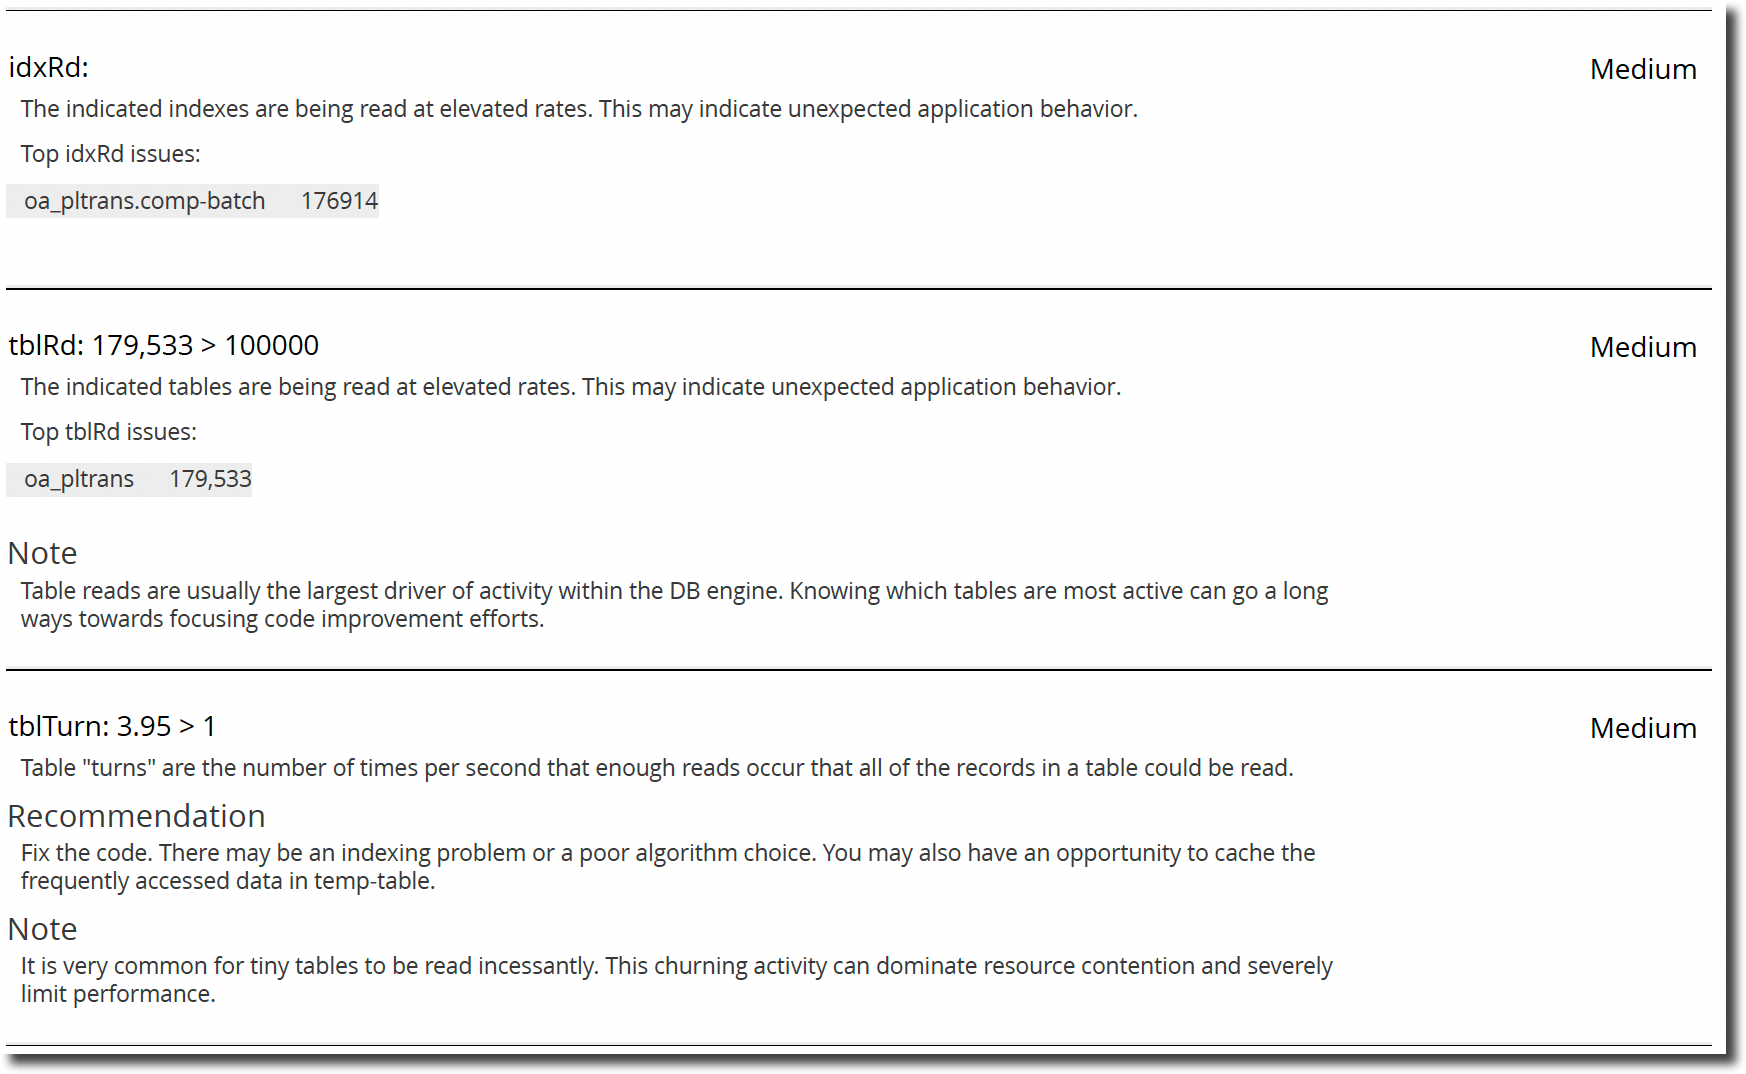
Turns can always be found in the ProTop Portal > Trend Data > Table and index statistics.
3. User complaints. If you don't have ProTop sending you these sorts of alerts or reports, perhaps you've had complaints of slowness. While this is much too vague to point directly to excessive reads causing the condition, it can always be quickly ruled out by simply opening ProTop real-Time (RT) for the implicated database(s). The default view immediately shows the highest read tables and indexes and the users with the most reads: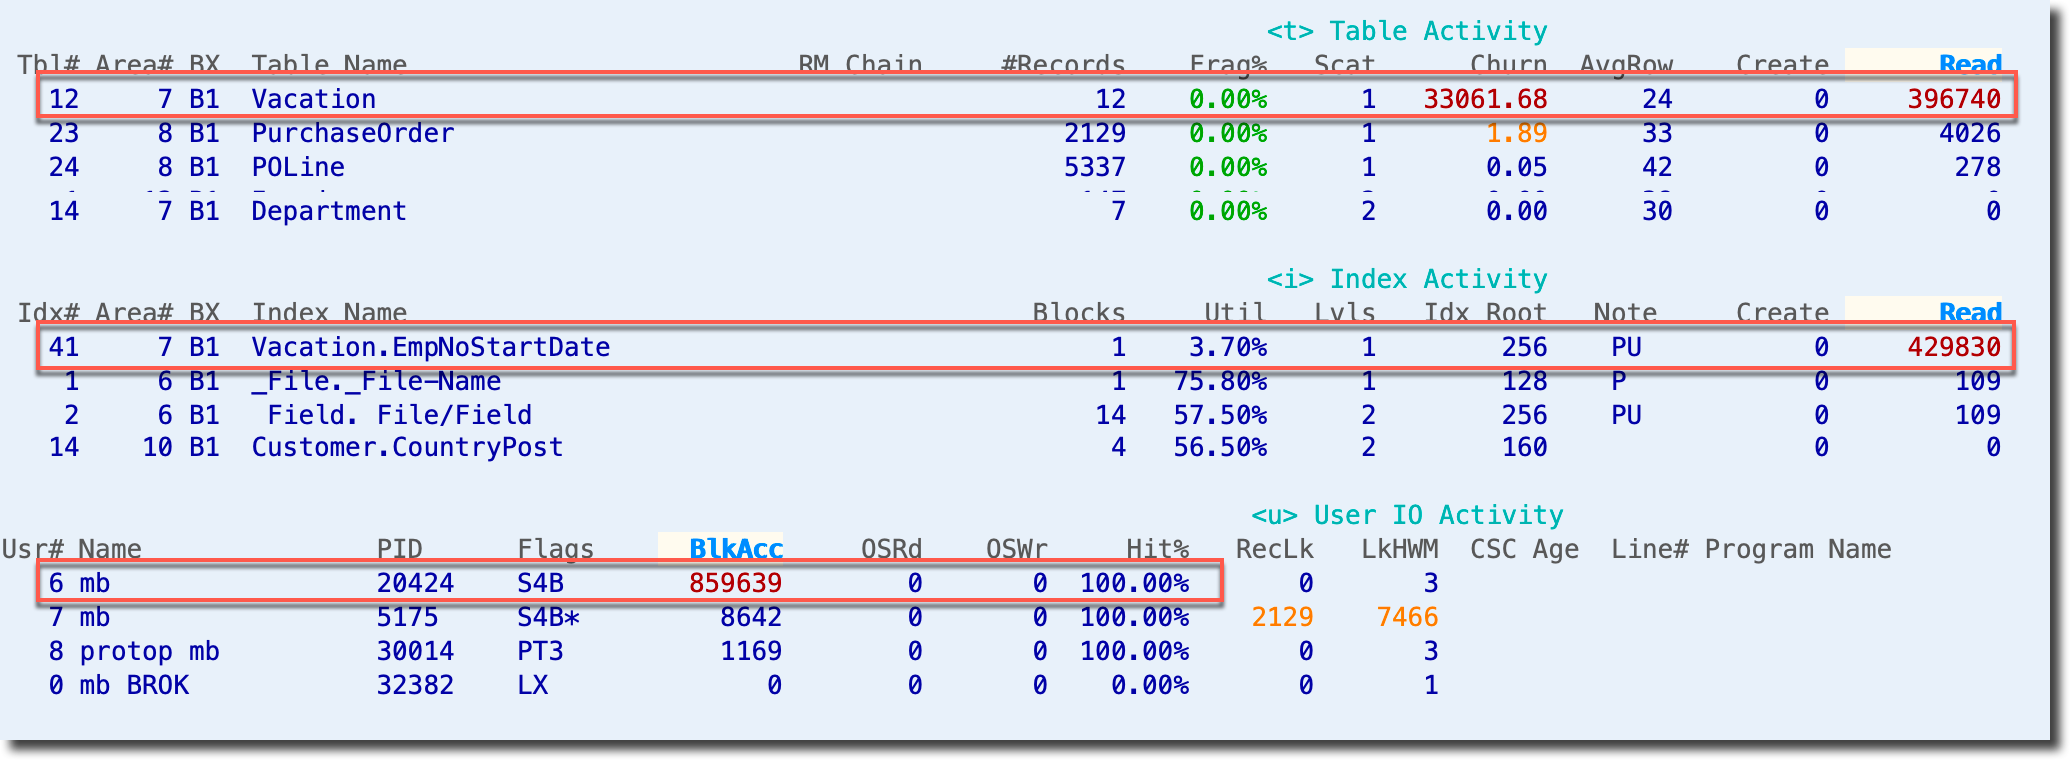
Getting at the root
We aim to find and examine the code doing the excessive reads in your application. We find that code by capturing the client statement cache for the user process doing the highest reads. We can come at this objective from a variety of directions.
NOTE: To find PASOE code, see this Progress KBase article:
How to capture a stack trace from a PAS for OE ABL Session?
Starting from an alert indicating excessive logical reads (LogRd above) ...
In the LogRd alert, you are given the highest-read table name and number. Start ProTop RT against the database exhibiting the issue and use the "8" command key. Enter the table number and the "Users of a table" panel in ProTop RT.
For example, in the image below, we used the command key "8" and entered the table number "12". ProTop shows: <8> Users of "Vacation" in the header along with the table number, areaNum and the number of records in the table. After a screen refresh or two, we see the users and processes using table 12, Vacation:

User number 6 happens to be the only user of this table at the moment. Notice the red box in the image above. It has the labels "Line# Program Name," but they are not populated. Now that we know a user number, 6, in this case, we can enable the client statement cache for this user, and with a bit of luck, we'll see the line number and program name.
We tell ProTop RT which user number to focus on by using the "#" command key. It will prompt you for a user number and how to pull the client statement cache (off, one line or a stack). We'll use 1 for one line.
After another refresh, and assuming the process doing the most reads is accessing the database (actual round trips between the client and the database are occurring), you should now see the Line# and Program name:
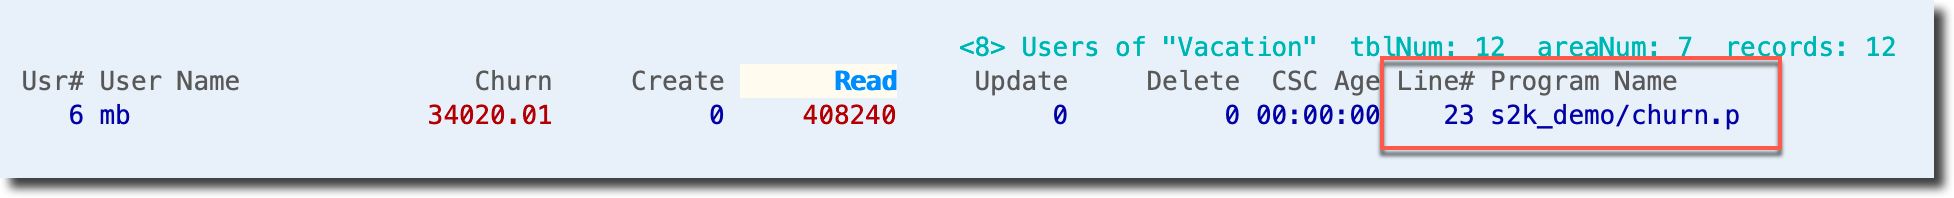
Now it's up to you or your development team to investigate churn.p and see what the lines around line 23 are up to and determine if the code can or needs to be refactored to decrease the high reads.
If you start with a user number ...
In the tblRd alert image above, we see Usr# 327. The simplest thing to do to see what that user is doing is to use the "#" command key to set the user number and client statement cache level. Use 1 again, but if you called for a stack, this is where you would see it. Then use the "U" command key in ProTop RT to see the User Information Viewer. We are using user number 6 again in our example. Here you see all of the user's activity for this session, including the Line# and Program Name of the code they are currently running: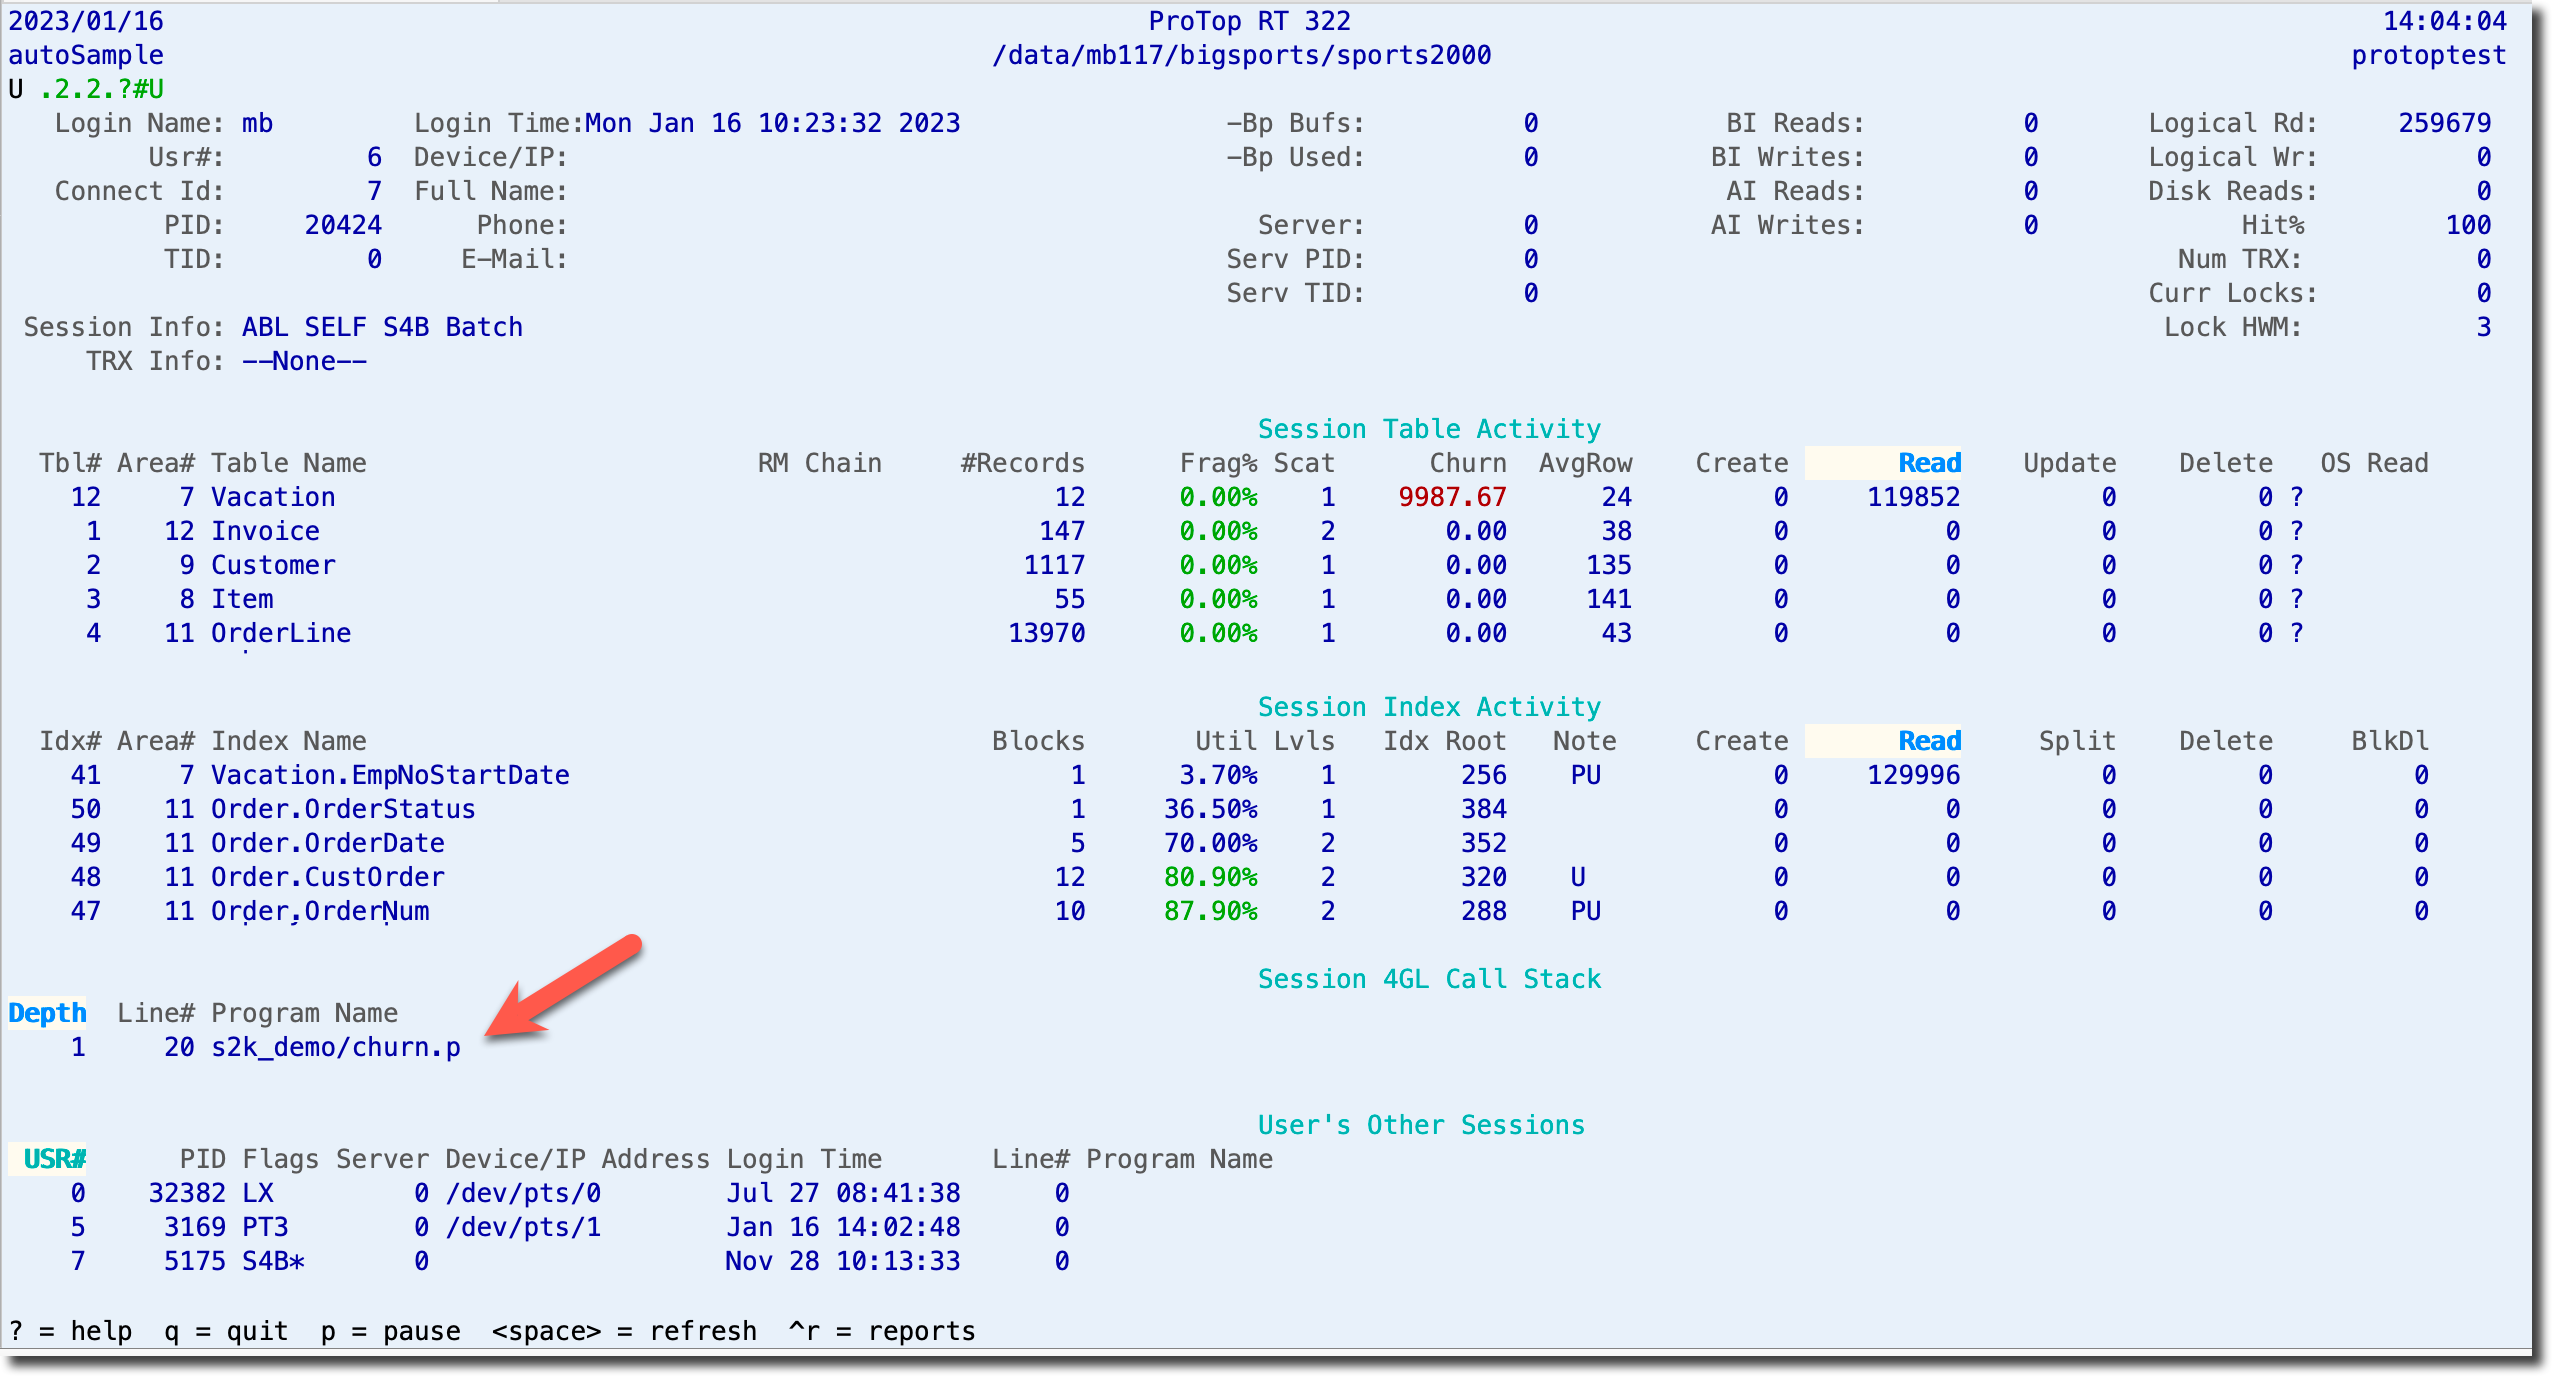
Again we now have the culprit code and can investigate how to improve that logic to decrease reads.