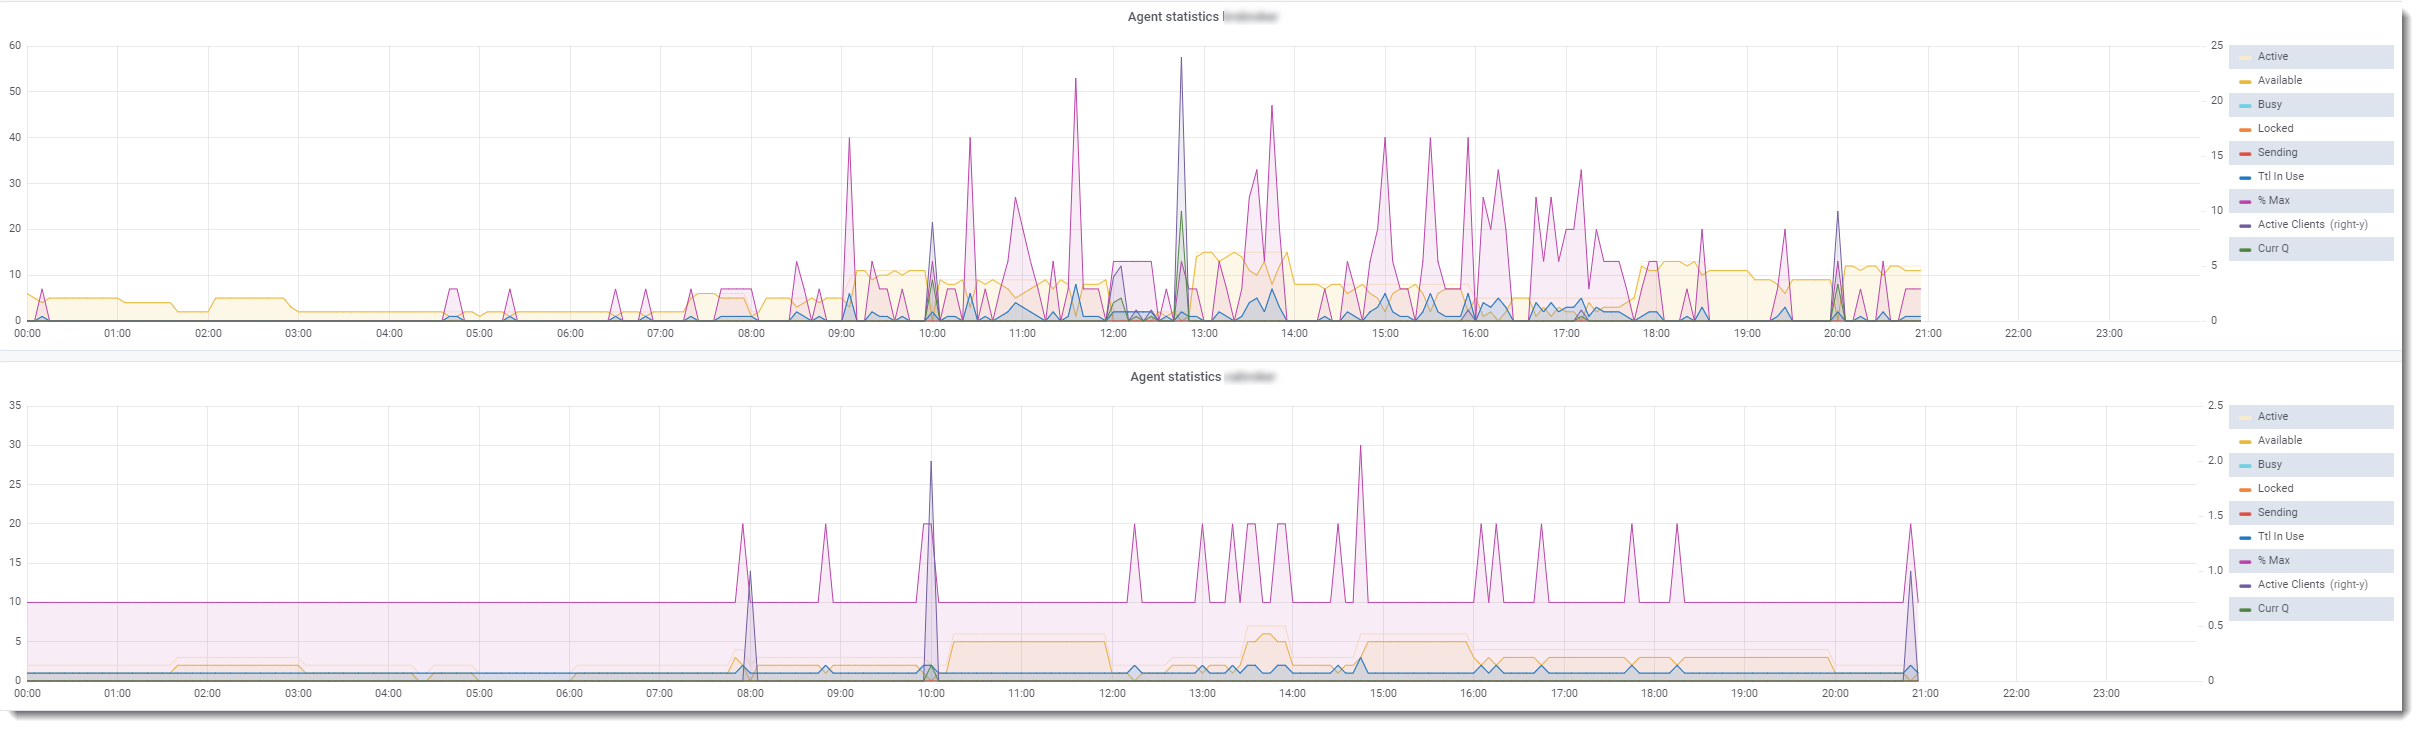
The trend data for each classic application server and/or Webspeed broker monitored by the resource chosen from the ProTop (Alerts) Dashboard is displayed in its own graph. The example below shows two of these universal brokers.
| Field | Information |
| Active | Number of running agents |
| Available | Number of agents available to fulfill requests |
| Busy | Number of busy agents |
| Locked | Number of locked agents |
| Sending | Number of sending agents |
| Ttl in use | Total number of active/busy/locked/sending agents |
| % Max | Total agents in use divided by MaxAgents, as configured in ubroker.properties |
| Active Clients (right-y) | Number of connected client processes |
| Curr Q | Number of requests to the broker not yet assigned to an agent |