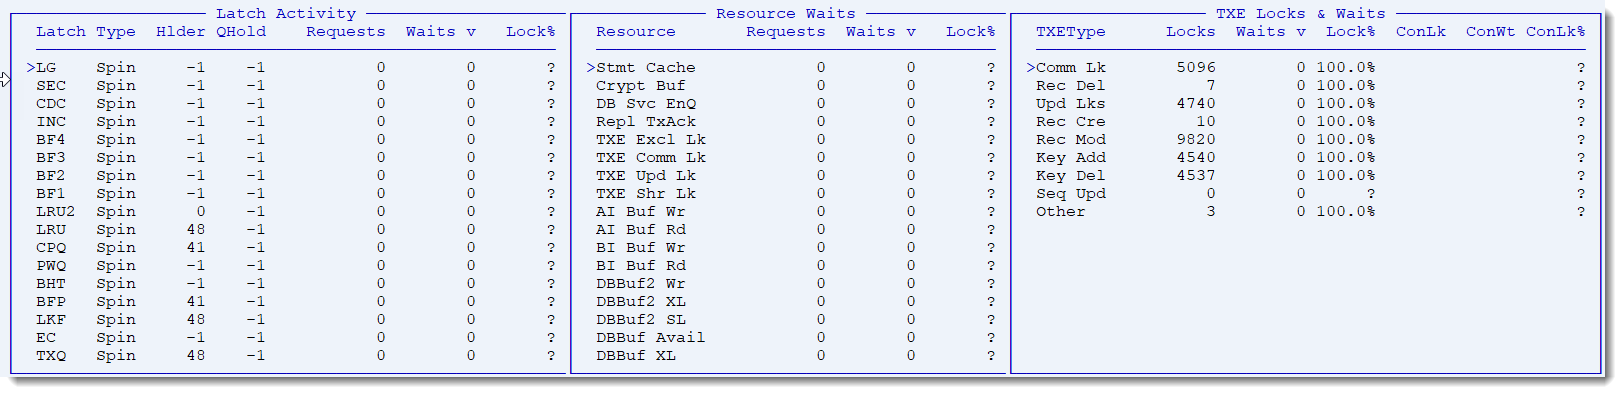
Monitors latch/resource activity. Latches are usually held for just a few CPU cycles. Anything specific is already old. If the data persists across multiple intervals someone is possibly blocked and holding a latch.
Latch Activity
| ProTop RT Label | Alertable Metric* | Description |
| Latch | N/A | Latch code |
| Type | latchType | Latch type, usually "spin" |
| Hlder | holder | User Number of the last user holding the latch |
| QHold | QHolder | User number(s) of user(s) waiting for the latch |
| Requests | latchReq | Number of requests for that latch |
| Waits | latchWts | Number of times the process fails to get a latch because of excess spin |
| Lock% | latchLkPct | Percent of time the latch is locked |
Resource Waits
| ProTop RT Label | Alertable Metric* | Description |
| Resource | N/A | Resource name |
| Requests | N/A | Number of requests for that resource |
| Waits | latchWts | Number of times the process fails to get a latch because of excess spin |
| Lock% | N/A | Percent of time the resource is locked |
TXE Locks & Waits
| ProTop RT Label | Alertable Metric* | Description |
| TXE Type | N/A | Transaction type |
| Locks | N/A | The number of locks a transaction holds |
| Waits | latchLkPct | Number of times the process fails to get a latch because of excess spin |
| Lock% | N/A | Percent of time the transaction holds locks |
| ConLk% | Not in use | |
| ConLk | Not in use | |
| ConWt | Not in use |
*Requires data collector "LatchActivity" in pt3agent.cfg. With the commercial version of ProTop, you can configure alerts using the metric names in this column. For a full list of metrics, see the Alertable Metrics section.