Configuration steps:
1. To successfully run the new Pro2 data collector, you will need two logical db connections. Add them as appropriate to your OpenEdge database startup parameter file:
# etc/pro2_sample.pf
# database that contains the "classic" pro2 repl tables
# they might be embedded in the application db in which
# case you just need the "-ld pro2repl"

-db /db/pro265/repl -ld pro2repl

# database that contains the new pro2 v6 repl tables

#
#   - for pro2 v5 comment this out and add 'pro2version "v5"' to etc/protop*.cfg
#
#   - if this is pro2 v6 and you CANNOT connect to the pro2
#     db then you will also need to set canProbe = no in
#     etc/protop.resource.cfg

-db pro2 -ld pro2v6 -H 192.168.0.123 -S 9999 -ct 0
Pro2 v5 has just a single logical database – “pro2repl”. The previous Pro2 data collector did not need this logical db name because that schema was usually embedded within the application db.
However, many Pro2 v6 installations are now deploying that as a stand-alone database. It is usually on the same server as the application database and can, therefore, be connected with shared memory. If the pro2repl schema is embedded (possibly because the system was upgraded from Pro2 v5) then you only need to add the “-ld prorepl”. If it is a stand-alone db you will need the db name and, if remote, the appropriate -H and -S.
Pro2 v6 also has an additional “pro2”, database, which might be deployed on either the main db server (and connected with shared memory) or on the Windows “pro2 server” that hosts the Pro2 v6 User Interface. If the pro2 database is remote, you might need to ensure that any firewalls between the servers allow an OpenEdge TCP/IP connection. If it is not possible to connect to that database, the Pro2 data collector will work, but some functionality will be degraded (the ability to detect whether a queue is actually running vs simply being enabled is the most significant loss).
3. Edit your etc/protop*.cfg file and add/set the following properties:
# Pro2
#

pro2version       ""    # if Pro2 is being used what versionz
                        # is it? ("v5" or "v6")

pro2tblXrefChk    900   # how often (in seconds) to check
                        # for replTableXRef updates

pro2useRTC        yes   # use replThreadControl instead of
                        # replControl

pro2chkRunning    yes   # should we try to check if a queue is
                        # actually running? (vs enabled/disabled)
4. Restart the agent by removing tmp/pt3agent.[*].flg. The dbmonitor will restart it shortly.
Remember that you should NOT edit etc/protop.cfg directly. Changes should be made in “the hierarchy” (so a site, server, group, or resource-specific version of the file), and ONLY changes are necessary. Default values and new properties will be inherited from etc/protop.cfg.
Furthermore, unlike bin/localenv, changes to etc/protop*.cfg are recognized in real-time. So, you should not need to restart agents if one of these values is modified.
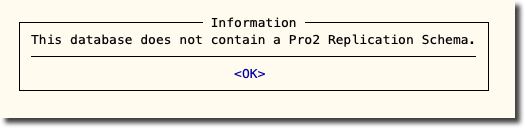
If neither of the logical databases is connected or if no evidence of the required schema is found in those databases, then the RT data collector will display the following message (once only):
Verification:
To verify that “Pro2Queues” is in use, look for 3 things in the logs - they can all be checked at once with this command on Unix (use FINDSTR on Windows):
grep -i pro2q log/pt3agent.friendlyName.log | more

2021/06/19 00:01:56.998-04:00 friendlyName 60 DBId,Dashboard,Configuration,TableActivity,IndexActivity,LatchActivity,ResourceWaits,StorageAreas,RemoteServerActivity,ReplAgent,Blocked,ActiveTRX,UserIOActivity,df,OSInfo,Pro2Queues

2021/06/19 00:01:57.483-04:00 dc/pro2qmon.p has been initialized as Pro2Queues

2021/06/19 00:02:25.959-04:00 postData: pro2q 5 records, 6 lines, length= 401
. . .
The final line is hopefully repeated many times. That is the line in the log file showing that the pro2q data is actually going to the portal.
Background:
Procedure dc/pro2mon.p is the old data collector that was previously bound to the “2" key in ProTop and known as "Pro2Activity" (pt3agent.p can still use it but protop.p cannot). Procedure dc/pro2qmon.p is the new data collector bound to "2" and known to pt3agent as "Pro2Queues”.
Here's an example of the Pro2 Queue panel brought up when the "2" key is invoked in ProTop. Each column is described below.
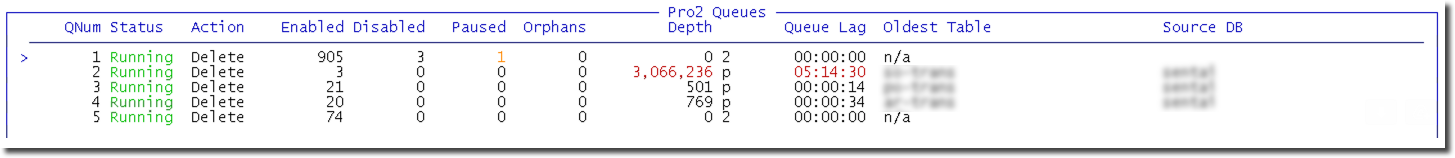
Each queue (QNum) is monitored individually.
The only known Status is “Running”.
Possible values of Action are:
-
“Delete”, which means that replQueue records are deleted after processing
-
“Mark” which means that a flag is set but the record is retained after being replicated
The Enabled/Disabled/Paused and Orphans columns correspond to the number of tables classified as such.
Orphaned means that we found a record for a table in the queue that is NOT listed as belonging to that queue - this might happen if someone changes their mind and decides to remove a table from Pro2. That can disrupt the queue record counts and processing so if it happens it needs to be addressed - thus there is an alarm for orphans > 0 (see beow).
If you do have “orphan” replQueue records you can add PRO2QSKIP2SEQ=n to you bin/localenv file. Where "n" is determined by running ad-hoc queries on replQueue. This will skip past the orphans and start counting at the next sequence beyond the orphans.
Depth is the number of records in that queue that are waiting to be processed. It is calculated in one of 3 ways, the single character column to the right tells you how it was calculated:
-
x = "exact". We counted each record. There is a bin/localenv variable, PRO2QCOUNTLIM, that defines how small a queue is small enough to be counted. The default is 1,000.
-
2 = “Pro2". That means that we use the values that Pro2 calculates internally. These are only updated every 30 minutes so they are very stale. We prefer not to use these values but might do so if it is too expensive to do it ourselves.
-
p = “proportional”. We look at the oldest record in the queue and compare its sequence to the next value that Pro2 will pull from the db sequence it is using. We assume that records are randomly distributed to the queues. The PRO2QESTIMATE variable can be used to suppress proportional estimates which will mean that Pro2 values are used instead. Proportional queue depth is not 100% accurate (although it seems to be within 1% in testing) but it is very fast to calculate.
The Queue Lag is the age of the oldest record in the queue. By default we alert at 30 minutes and alarm at one hour (see below). Some users may prefer more aggressive alerts for lag time. Use zLagTime as the alert metric, zLagTime is seconds as an integer rather than an hh:mm:ss string and, therefore, is much easier to write alerts for. If the oldest record is more than a day old the number of days will appear to the left of the hh:mm:ss, zLagTime will be a very large number of seconds. Don’t worry, zLagTime is an int64 ;)
At times very small queue depths may show a lag of zero (or blank) and an oldest table of n/a. This is because the queue catches up while ProTop is in the process of collecting data about it. This is not considered to be a problem.
The Oldest Table in the queue is just for information purposes. It is unlikely to make any sense to want to alert on that but does tend to give a sense of what table’s records a queue is processing.
Ditto the Source DB. The source db name is the "Pro2 name” for the db. It is not the ProTop friendly name nor the db physical name. This name might be handy if you need to talk to a Pro2 admin or use the Pro2 admin console.
The Pro2 schema is not in every database and the replicated data might come from multiple databases. So the data collector uses dynamic queries and it will complain politely if you try to run it in a databases that does not support Pro2:
Default alerts in etc/alert.cfg:
rq_pausedTbls num > 0 "" "daily" "&1 &2 &3" alert
rq_orphanTbls num > 0 "" "daily" "&1 &2 &3" alarm

rq_qStatus char <> "Running" "" "hourly" "&1 &2 &3" alert

rq_Depth num > 100000 "" "hourly" "&1 &2 &3" alert
rq_Depth num > 1000000 "" "hourly" "&1 &2 &3" alarm

zLagTime num > 1800 "" "hourly" "&1 &2 &3" alert
zLagTime num > 3600 "" "hourly" "&1 &2 &3" alarm