Server Metrics
Server Metrics
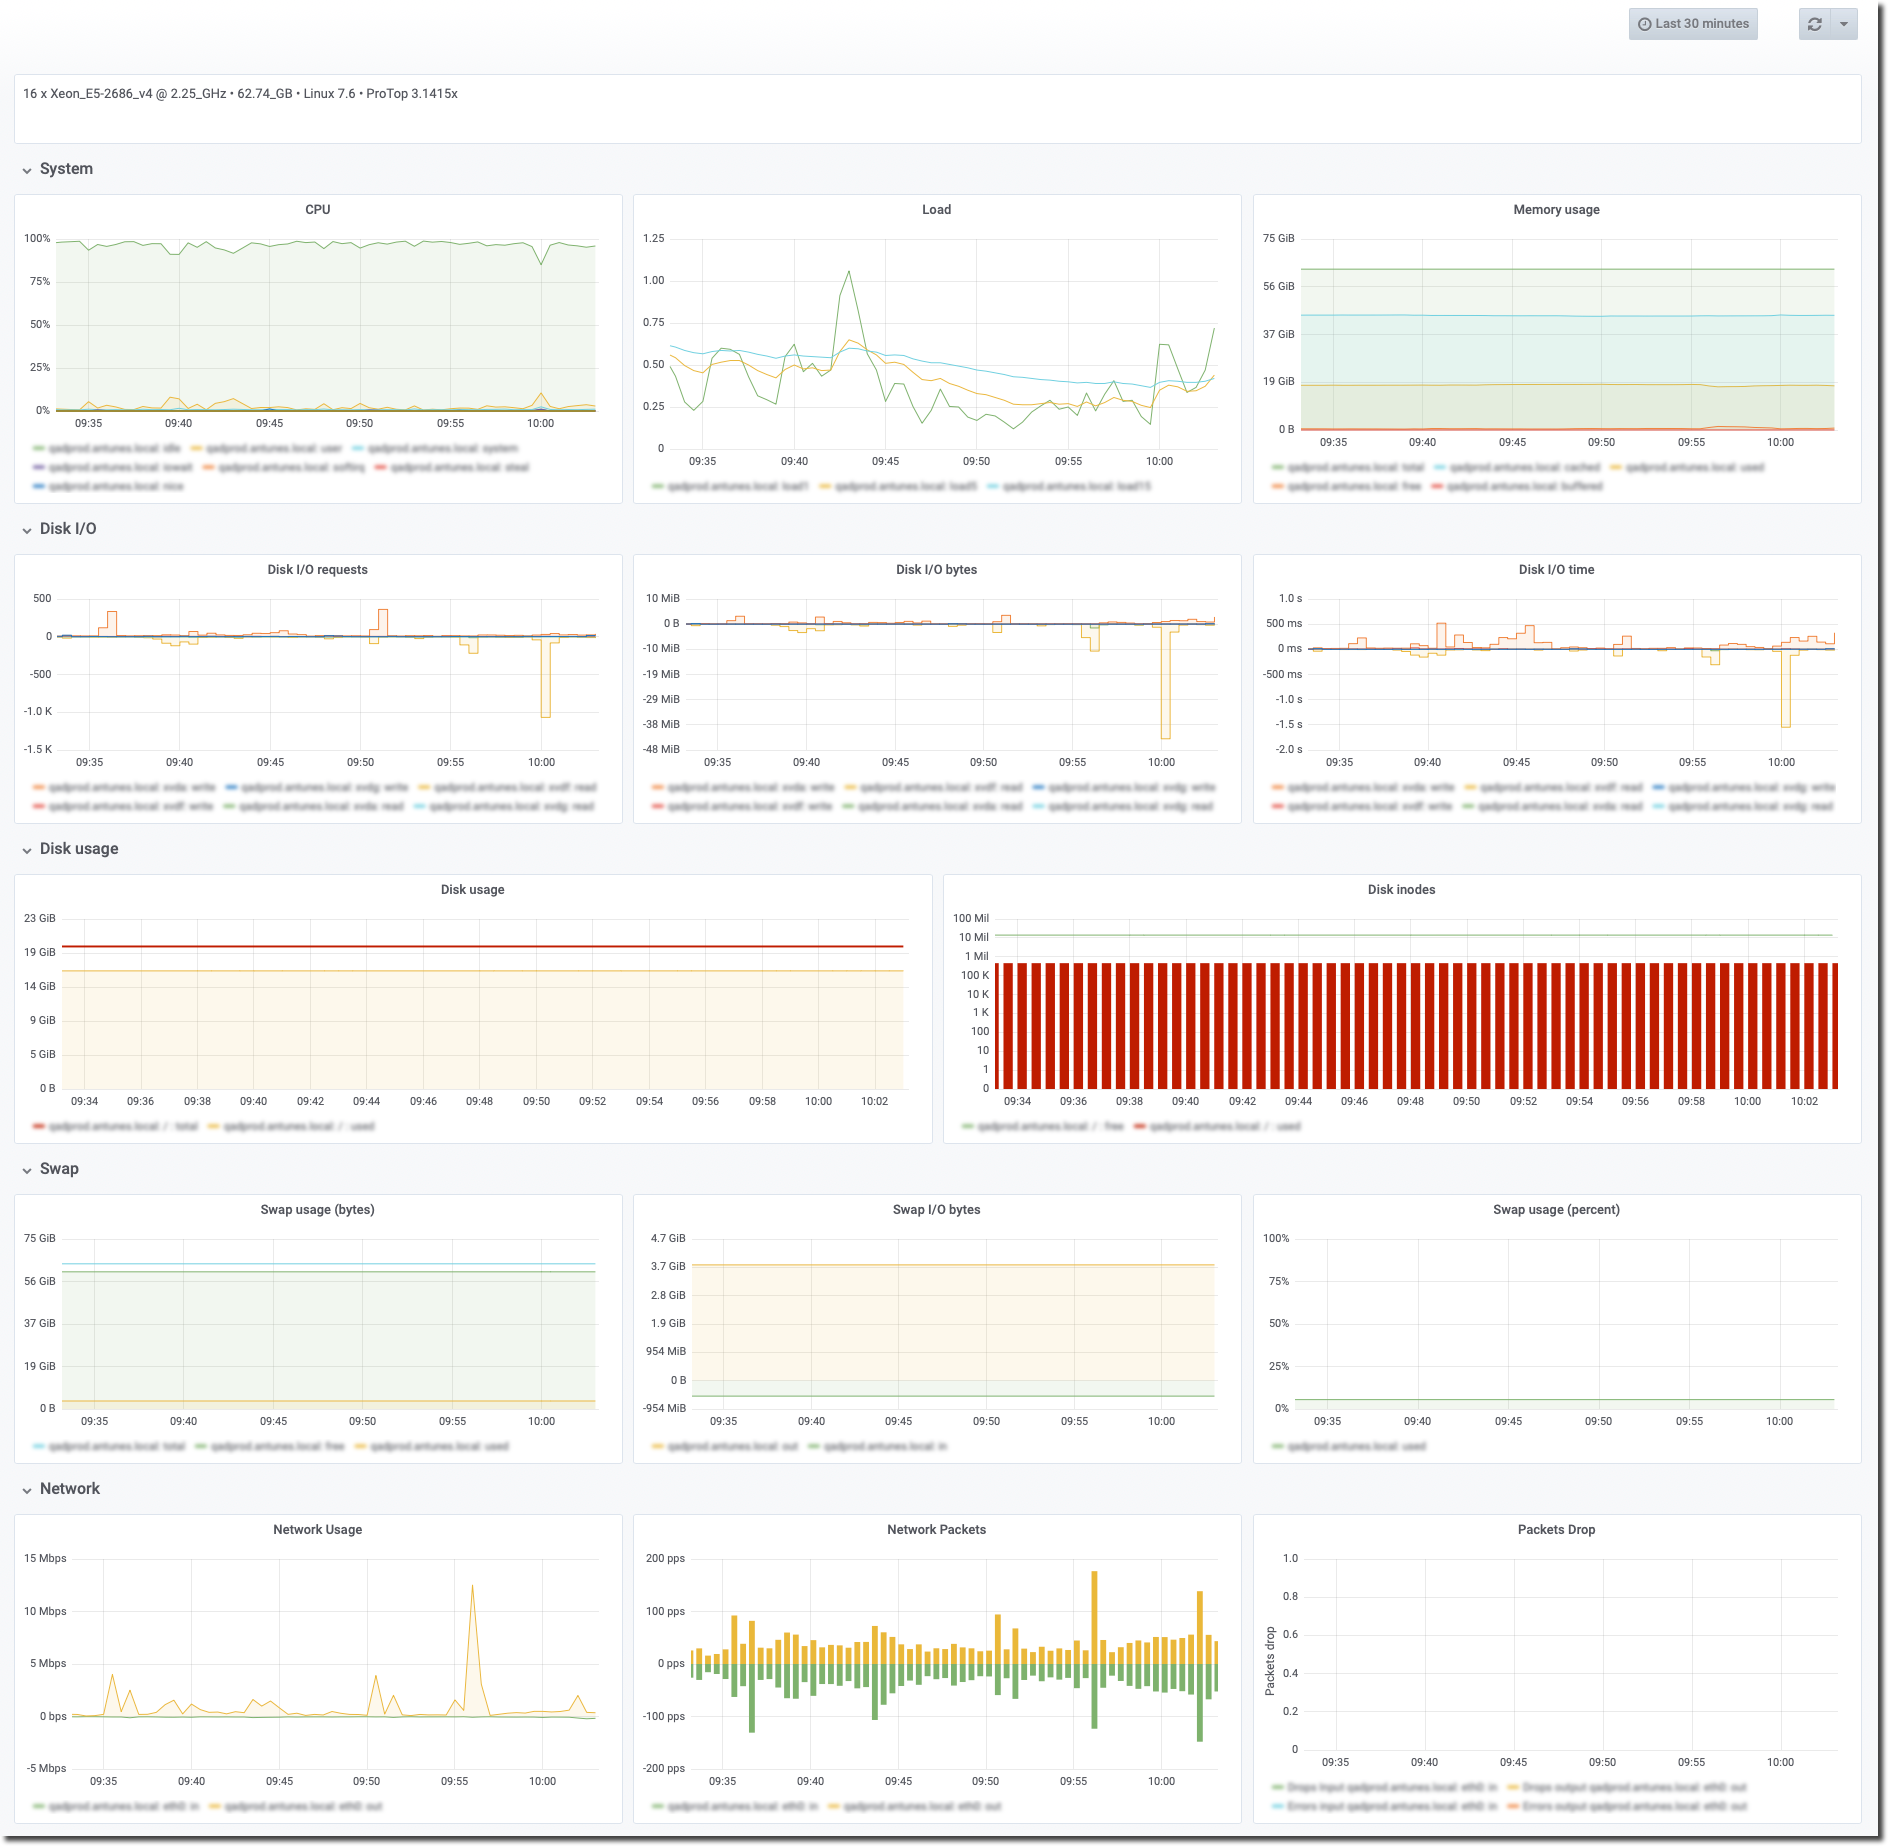
While ProTop is not an operating system monitoring tool, it is very useful to have operating system metrics available to correlate with database activity. ProTop does this by installing an open-source package called telegraf, which uploads data to the ProTop web portal.
Telegraf gathers all the necessary operating system metrics, such as CPU usage, load averages, memory usage, disk I/O and network I/O and sends them to the portal for viewing here. A different selection of metrics and graphs will be displayed depending on the Operating System used by the resource.
Here is an example from a Linux server:
