Alerts are color-coded:
- Yellow means "warning"
- Orange means "alarm"
- Red means "page"
- Blue means "information"
- White means "code" or that the alert was created by a "script" action in the alert definition
When in a multi-site view, only a limited history of alerts is shown: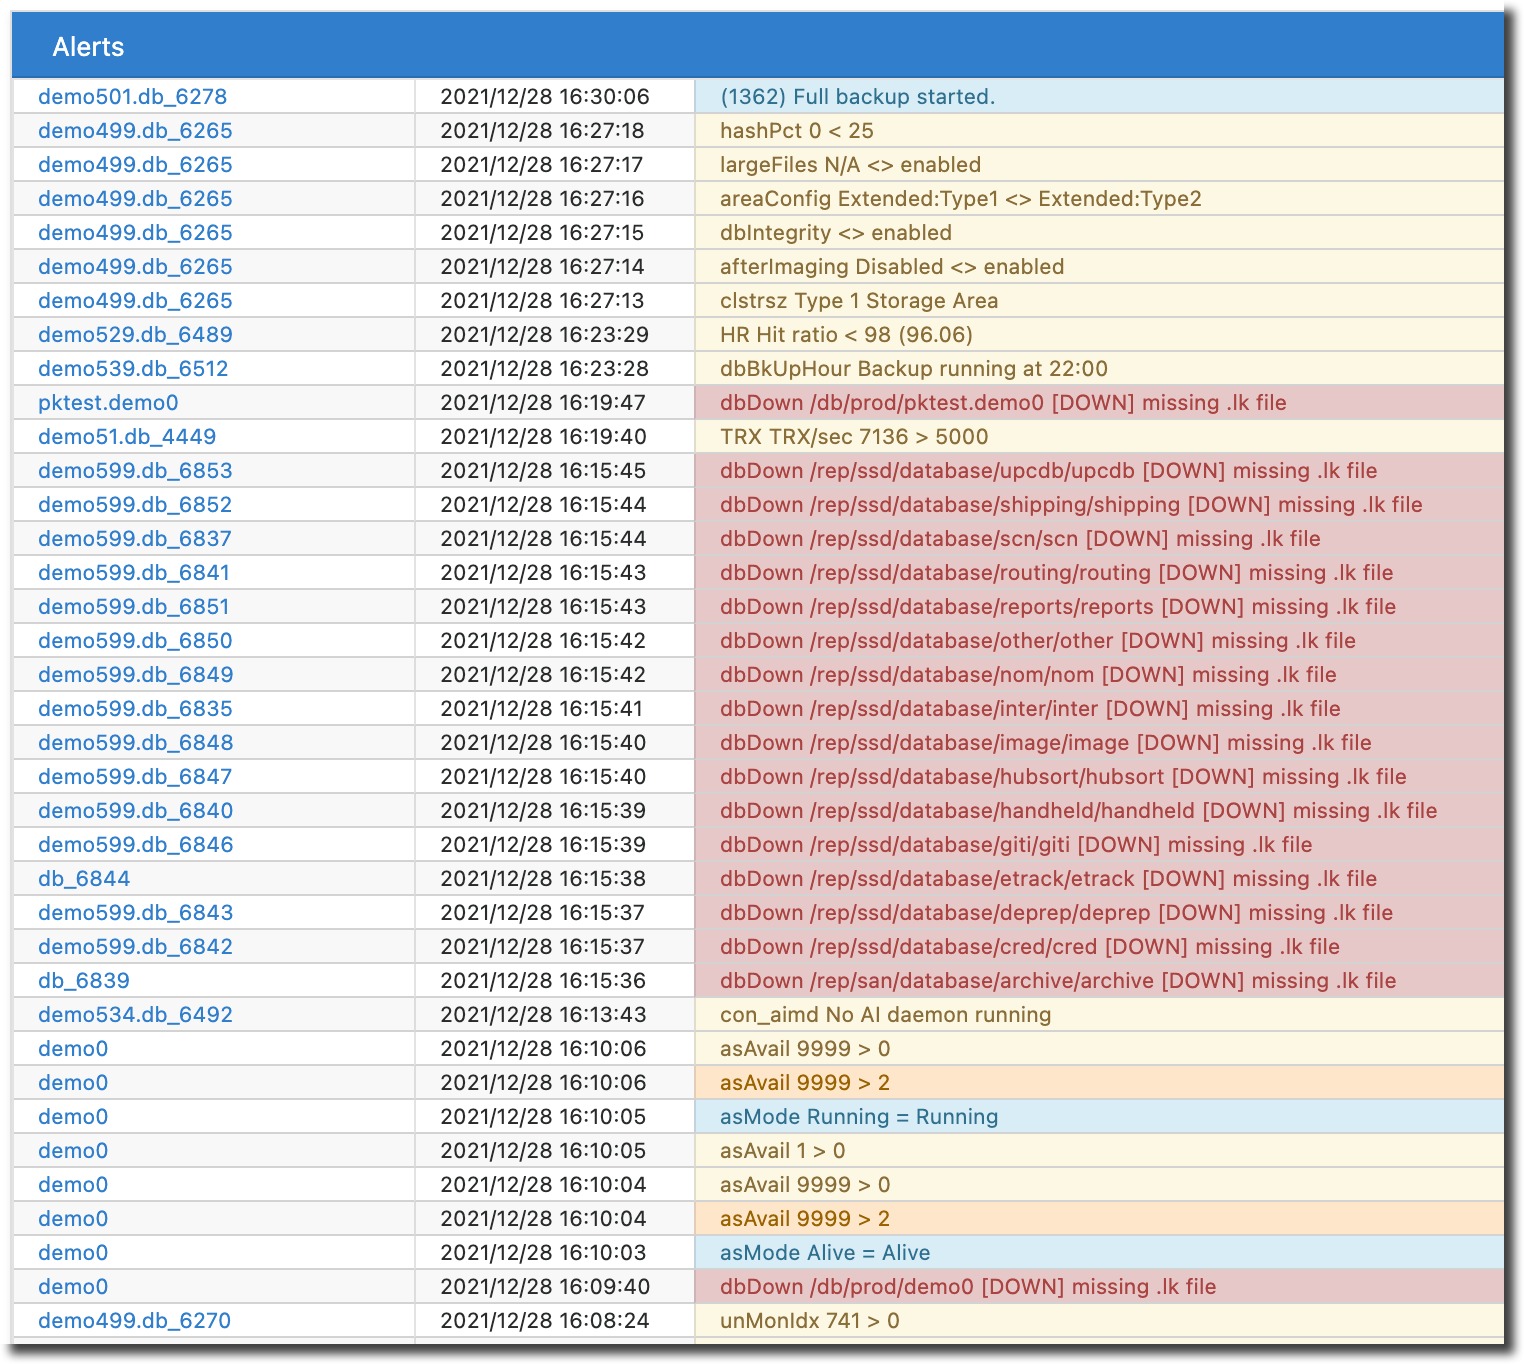
Filtering alerts
To quickly filter alerts to only those for a specific resource, in the Resources window to the left, click on whitespace anywhere on the resource line of interest. That resource will now be highlighted in blue, and the Alerts window will repaint, showing only alerts for that resource.
Clicking directly on the Resource name link will take you to the Trends Dashboard for that resource.
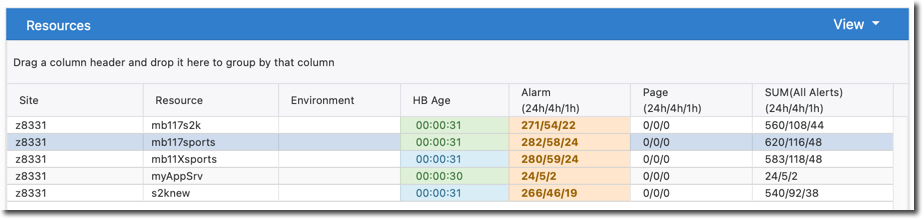
Clicking the Site name in the Resources window will filter the Resources to only those for that site and it will filter the Alerts window to show alerts for all resources of that site:
You can scroll back through the available alerts history when filtered to one resource.
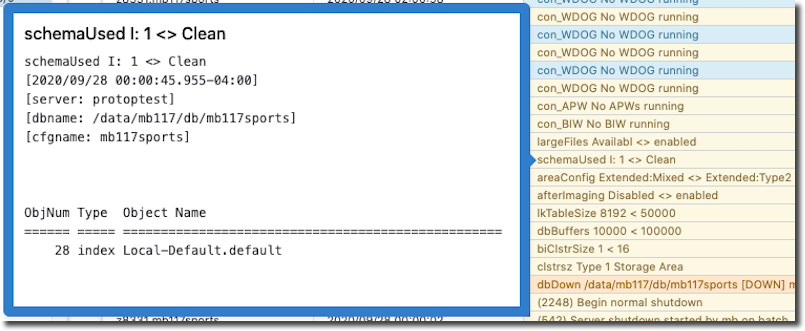
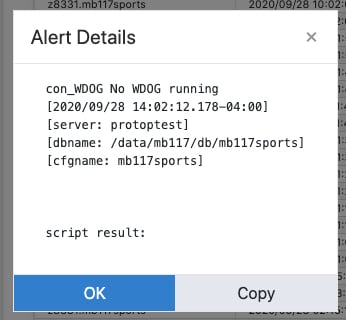
To see more details of a given alert, hover your cursor over the alert, and more details will pop up:
Each alert line contains a sub-menu of options for that alert. Right-click anywhere on the line of interest, and this menu will be revealed:
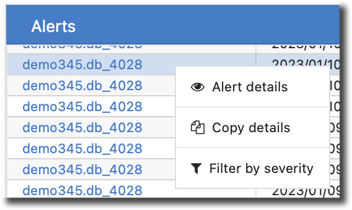
- Alert details - a box pops up in the center of the screen with the same details as when hovering, described above. This prevents the pop-up from disappearing when you move your cursor and also lets you copy the info to the clipboard.
- Copy details - copies the alert's details to the clipboard skipping any popup.
- Filter by severity - filters the window to show only those with the same severity as this alert you right-clicked.