Here's a quick video overview of the Alerts Dashboard
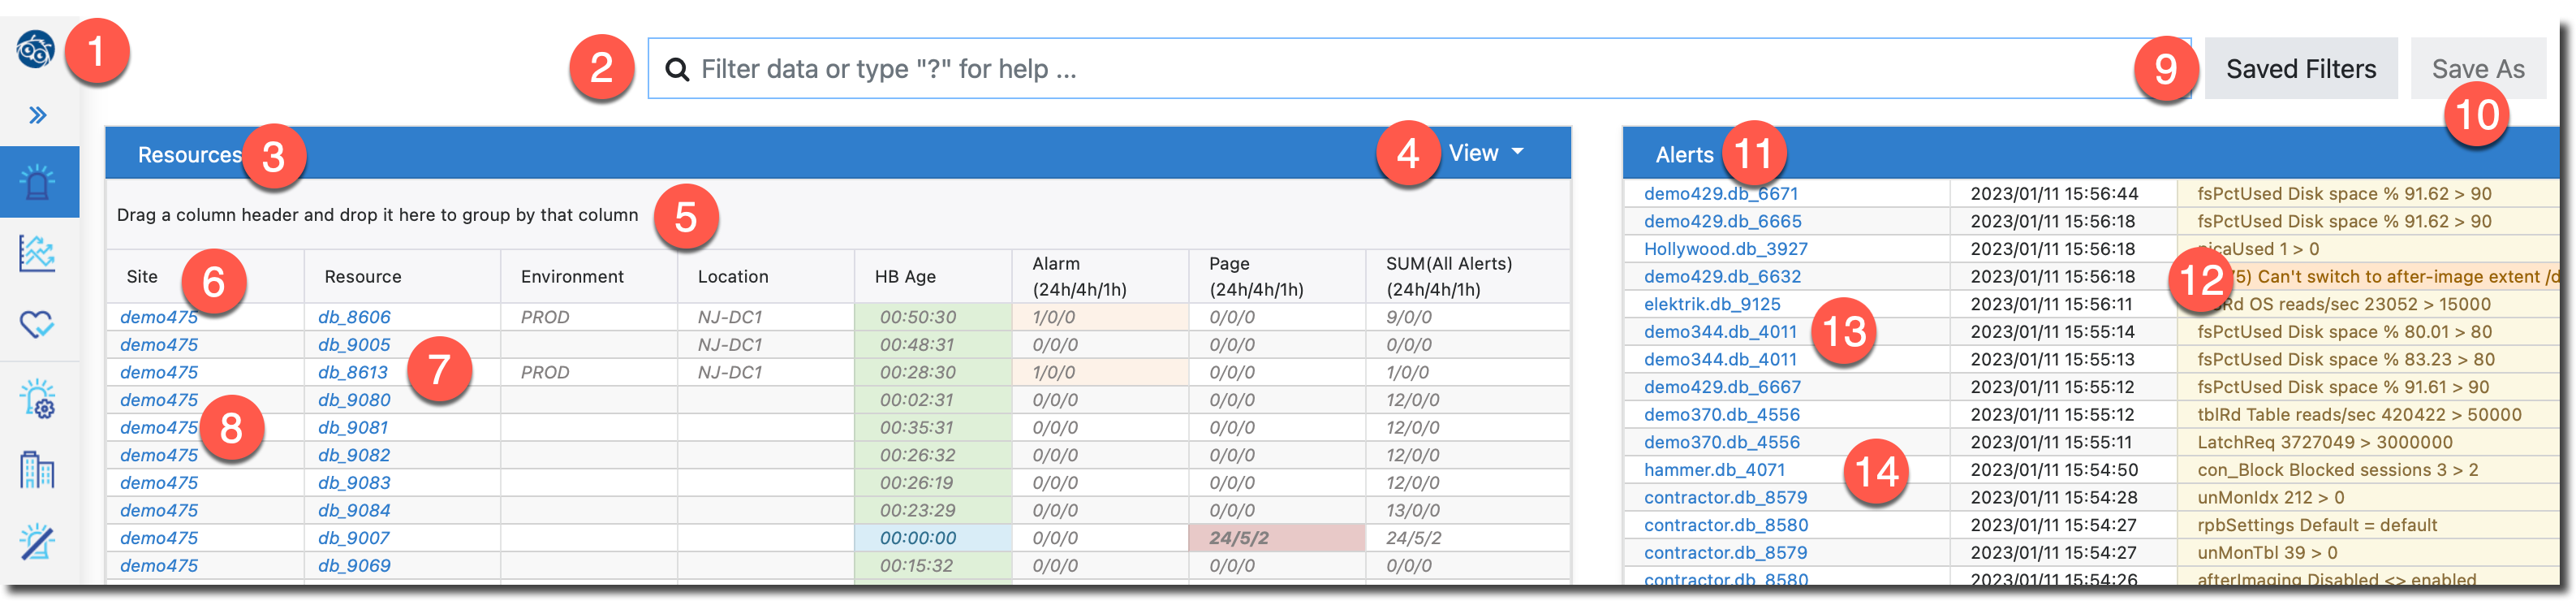
Here are the Alerts Dashboard components by the numbers:
NOTE: Listed below are the high-level features of the ProTop Dashboard which are covered in more detail in other articles which you can find by using the search box at the top of this screen.
| Number | Feature | Description |
| 1 | ProTop Logo | Click on the protop logo to return to this page from elsewhere in the portal; also the very top of the side menu explained below |
| 2 | Omnisearch Bar | Filter Sites, Resources, Alerts, and their attributes; Type a "?" and press enter to select and view the omnisearch guide |
| 3 | Resources Window | Lists Sites, Resources, Environment, Site Type, HB (heartbeat) age and the total number of Alarms, Pages and a Sum of Alerts over the past 24, 4, and 1 hour(s); HB Age is distinguished by color, turning red when the Age exceeds the resource HB Check value (minutes). |
| 4 | View | Create, use and manage saved Groupings and Sorts |
| 5 | Grouping | Drag and drop a column header like Site to this bar to group by that header |
| 6 | Sort | Click the header to cycle through ascending and descending sort order |
| 7 | Resource | Left-click whitespace on the Resource line; the line turns blue and displays alerts for only that Resource in the Alerts window; Right-click whitespace on the Resource line to display a submenu of actions available for that Resource; Click on the Resource Name to open ProTop Trends for that Resource |
| 8 | Site | Click on the Site name to show alerts for all Resources at that site |
| 9 | Saved Searches | Use and manage Saved Searches |
| 10 | Save As | Save this search and give it a name for future use |
| 11 | Alerts Window | Lists Site, Resource, Timestamp, and Subject for alerts that match search criteria and actions taken in the Resources Window |
| 12 | Alert Message | Shows the title of each alert message; hover over the title to display additional details for that alert; Information entries are in blue, Warnings are in yellow, Alarms are in orange and Pages are in red |
| 13 | Alert Resource | Click the Resource name to jump to ProTop Trends for that Resource |
| 14 | Alert Line | Right-click whitespace to display a submenu of actions available for that Alert/Resource |
Side Menu
Click the right-facing double chevron to expand the side menu:

Here is the menu with icons and text labels for the features available to your role. This is the complete menu visible to superadmin users:

The menu item with the blue background indicates the page you are on.
Click the double chevron at the top (now facing left) again to close the menu.
NOTE: This is the complete menu. You will see items appropriate to your role.
| Menu Item | Description |
| ProTop dashboard | This page. Clicking here will return to this page from anywhere in the portal |
| Double Chevron | Right-facing when collapsed and showing only icons, left-facing when expanded and showing icons and their text labels |
| Announcements | Important messages brought to you by your portal administrator |
| Alerts | This page |
| Trend Data | Opens the ProTop Trends page |
| Health Checks | Opens the Health Checks page |
| Uploads | Manage files uploaded to the ProTop Portal |
| Alert Responses | Configure where and to whom messages are sent in response to alerts arriving on the portal |
| Sites | Site administration - add, edit, and remove site attributes |
| Outages | Set dates and times for planned events during which Resources will be offline to communicate the outages and prevent automated Alert Responses from going out |
| Resources | Add, edit, and delete Resources monitored by ProTop |
| Users | Add, edit, and delete Users of ProTop in your organization |
| Chronograf | Allows administrators to create ad-hoc views of trend data |
| Portal Statistics | Data specific to this ProTop Portal Server |
| Portal Logs | ProTop portal log viewer |
| Portal Configuration | Add, edit, and delete portal configuration parameters |
| About White Star Software | Opens the supporting partner's About page in a new browser tab |
| Privacy Policy | Opens the Privacy Policy page on help.wss.com |
| Documentation | Opens this site in a new browser tab |
| ProTop Community Forum | Opens the forum page in a new browser tab |
| Email Support | Opens the default email client with To: set to support@wss.com |
| Demo Mode | Masks client-specific names for demonstration purposes |
| View As | Allows admins to see the portal as a specific user sees it |
| User Account | Allows the user to change their name, email address, and password |
| Sign Out | Closes the current session and opens the login page |