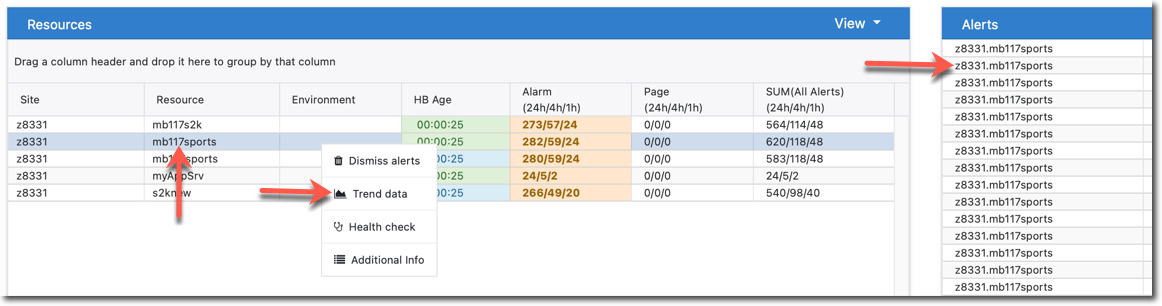
To access historical trend data, use one of these methods:
- Click on the resource in the ProTop Dashboard Resources Window or
- Right-click on the resource line and choose Trend Data or
- Click on the resource in the Alerts window
This brings you to the ProTop Trends Main Dashboard: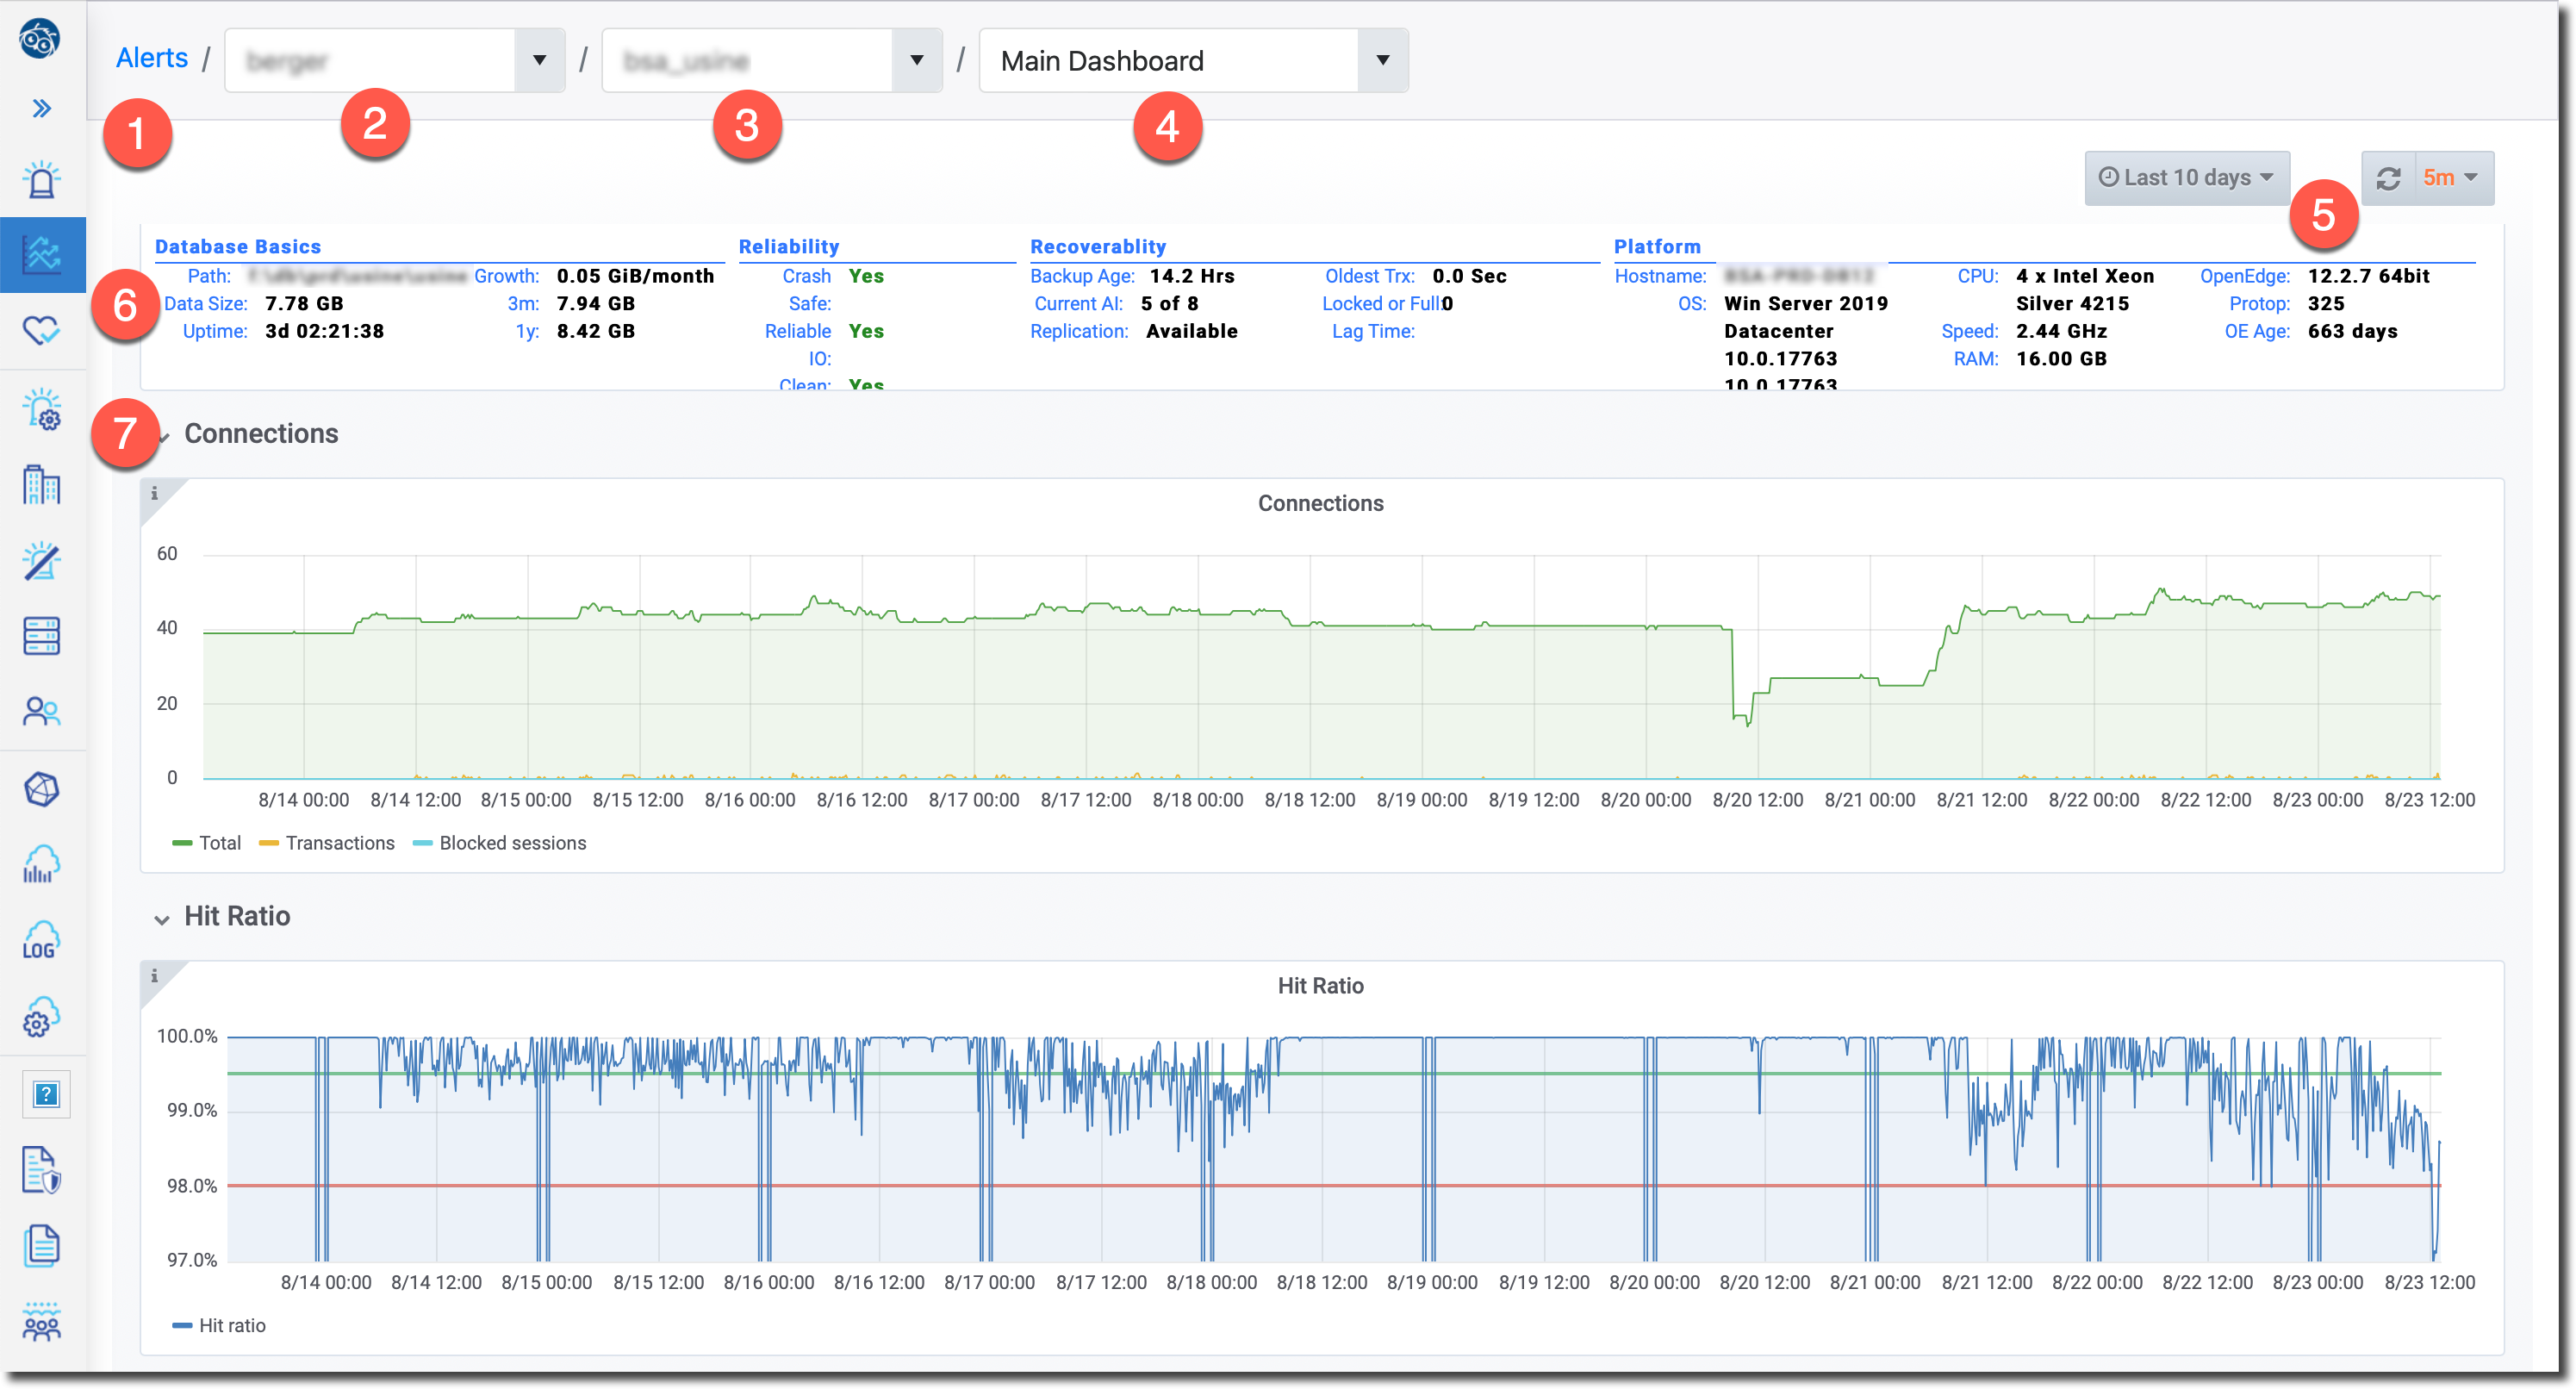
NOTE: Listed below are the high-level features of ProTop Trends, which are covered in more detail below and on subsequent pages.
| Number | Feature | Description |
| 1 | Logo/Home | Click any of the icon links in the upper left corner to return to the ProTop Portal Alerts Dashboard |
| 2 | Current Site | Click to choose a different Site |
| 3 | Current Resource | Click to choose a different Resource for this Site |
| 4 | Current Dashboard | Click to choose a different Trend Dashboard; see Trend Dashboards below |
| 5 | Time Frame and Refresh Interval | Change the date range and refresh interval to change the data shown in the graphs; see Time Frame below |
| 6 | Resource Overview | Shows essential characteristics of the current resource |
| 7 | Trend charts | The main trend charts follow. Connections, Hit Ratio etc |
Trend Dashboards
- Main: Provides a summary view of core database activity (image above)
- Advanced: Prodived a global view of important database activity
- Table and Index Statistics: Provides detailed CRUD statistics for individual tables and indexes
- Latches and Resources: Display both latch and resource activity and waits
- Application AppServers: Display detailed information on Webspeed brokers and classic app servers
- Server: Provides detailed CPU, memory, disk IO, and network statistics of the host
- Configuration: Displays startup, database configuration, and related configuration parameters
- Application Servers (all): Shows all App Servers for the site, not just this resource
- System Availability: Database Uptime and Detected Outages
- Storage Statistics: Database Space Usage and Efficiency by Component
- PASOE: Memory, Connections, Requests, Reads, and Writes by the Pacific App Server for OpenEdge
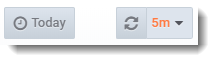
Time Frame and Refresh Interval
In the upper right corner, you can select the time frame and auto-refresh interval by clicking on the appropriate button:
Time Frame
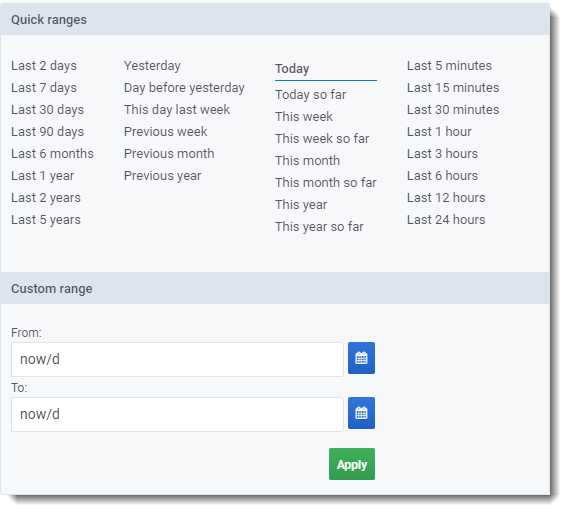
Clicking on the Time Frame button brings up the time range selector. Select one of the pre-defined ranges or enter your custom range.
Note that the free version of ProTop provides up to 48 hours of historical trend data. The commercial version of ProTop gives you access to up to 3 years of data, and if you convert from the free version to a commercial version, the historical data accumulated while you were on the free version becomes visible.
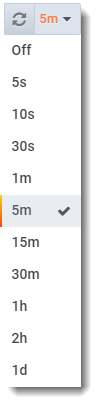
Auto Refresh Interval
Clicking on the auto-refresh interval button brings up a list of possible intervals for automatically refreshing the graphs:
Graph Navigation Features
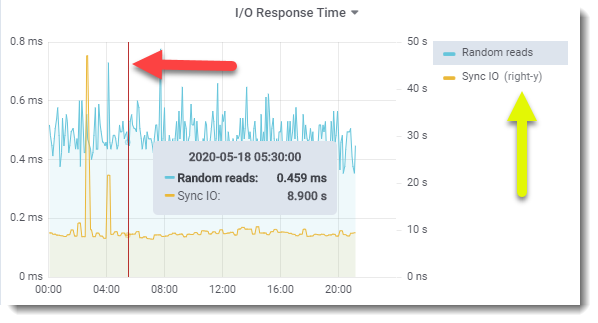
Hover
Hovering the cursor within any graph will bring up a vertical, thin red line designating a specific point in time. The same red line will appear at the same specific point in time in all the graphs on the page.
A gray box will also appear showing the data values at the designated time for fields listed. CAREFUL: Some data points use the left vertical axis while others, labeled with (right-y), use the right vertical axis.
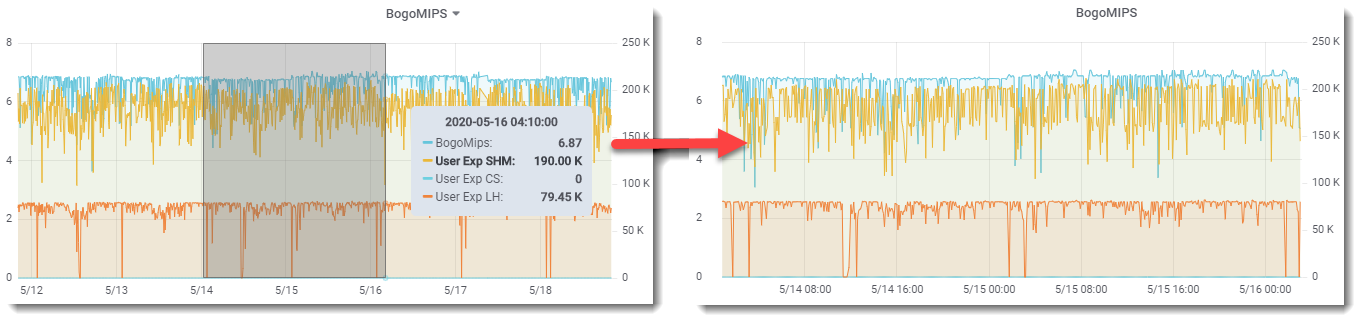
Zoom
Use the left mouse button click to highlight a section of the graph, then release the button to zoom in on that section. The zoomed time frame applies to all charts on the page:
Click the header of any graph and choose "View" to expand that graph to fill the browser tab.
Pan
With focus on any graph, hit the letter "t" along with the left or right arrow to move the time range backward or forward: