Advanced Dashboard: Lock References
There are a couple of references to locks in the ProTop Trends Advanced Dashboard. This is what they mean.
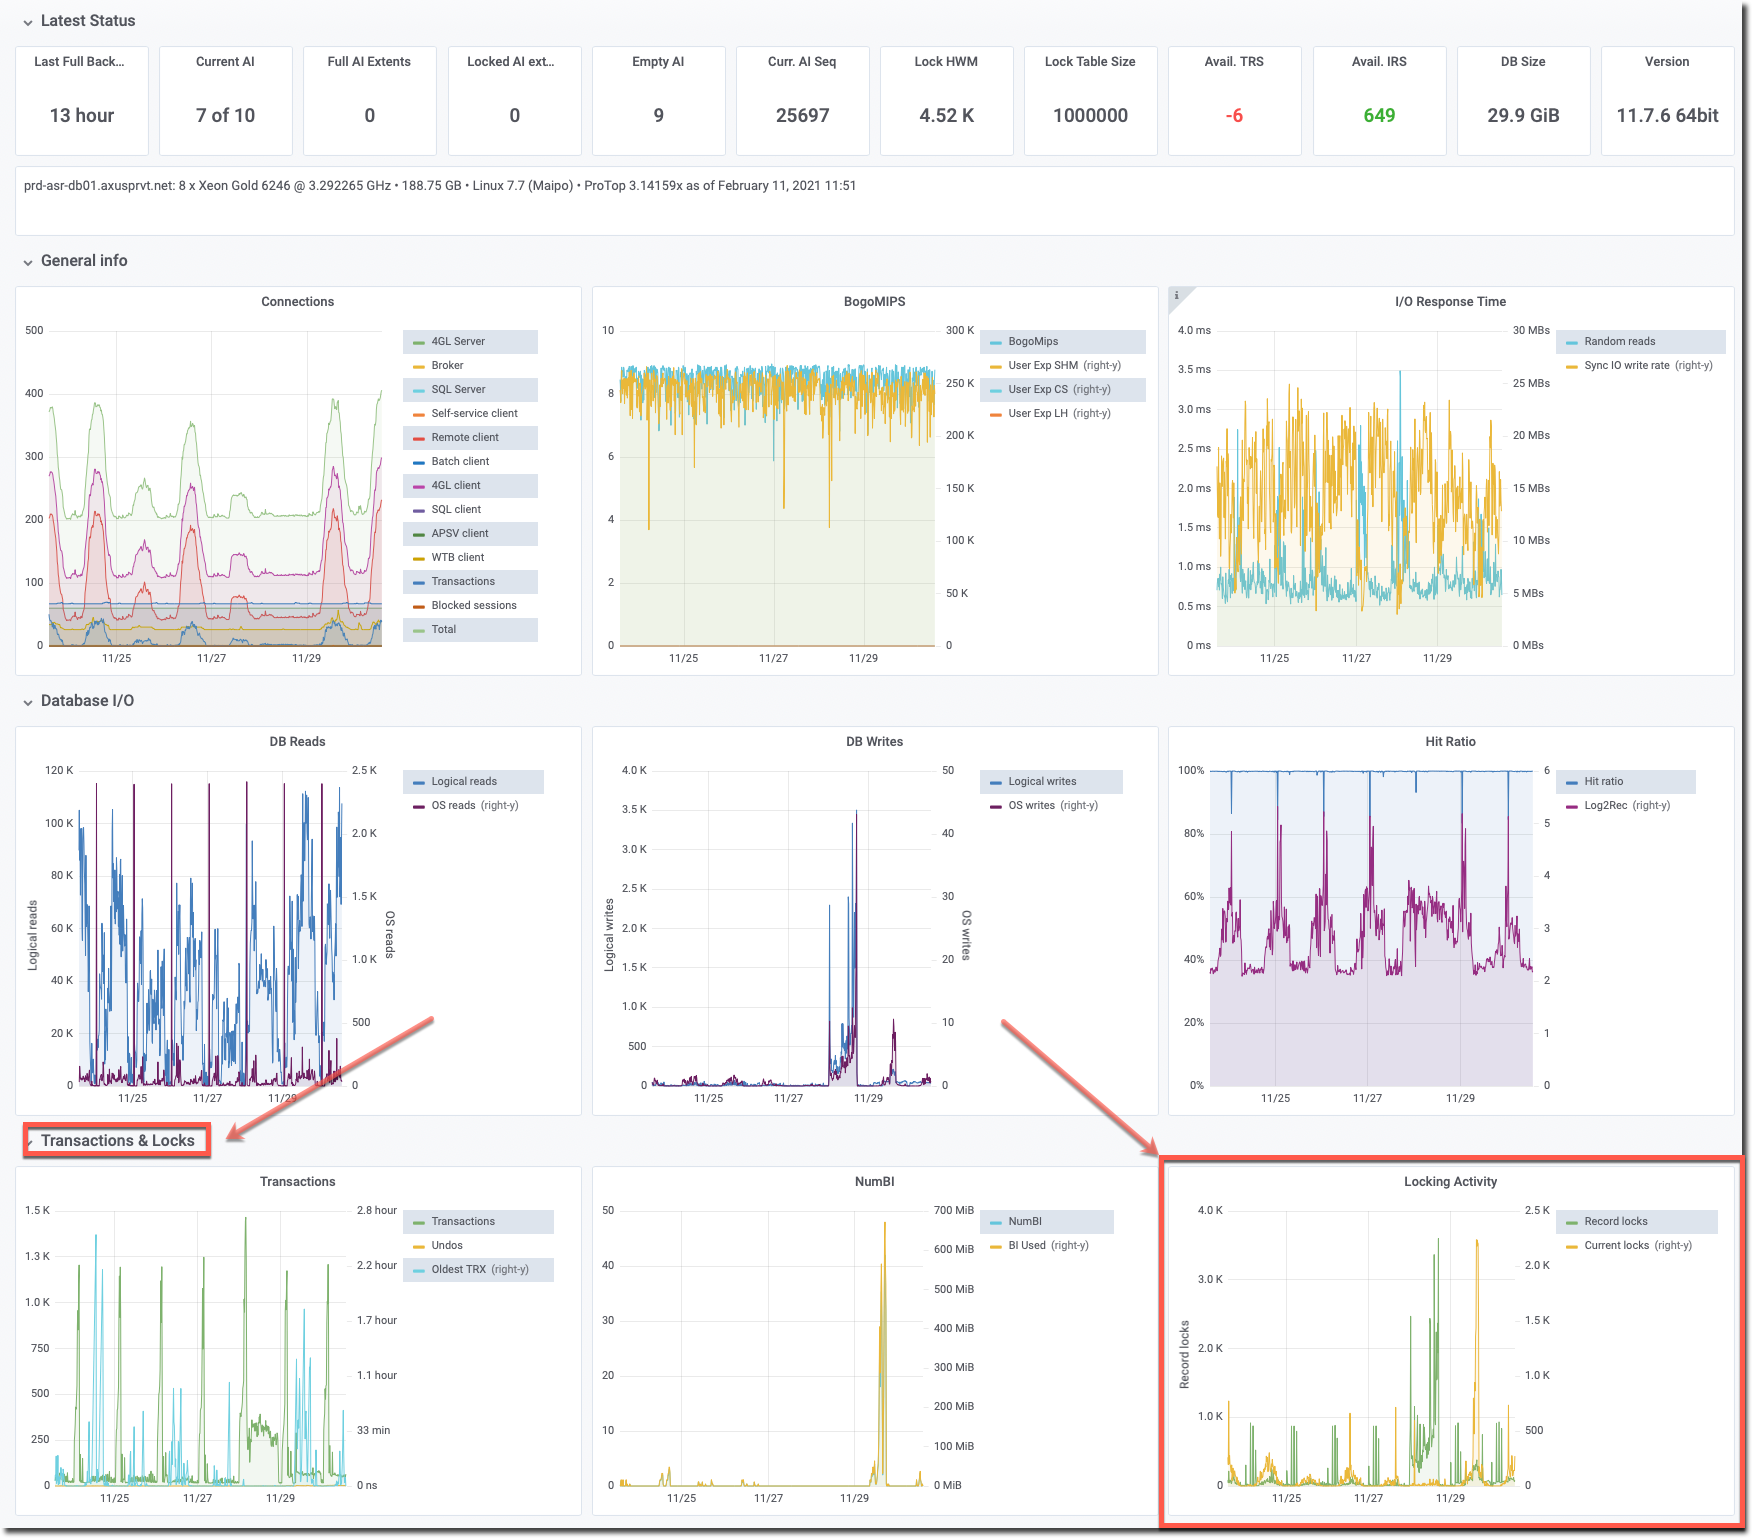
The Locking Activity graph is at the end of the fifth row under Transactions & Locks:

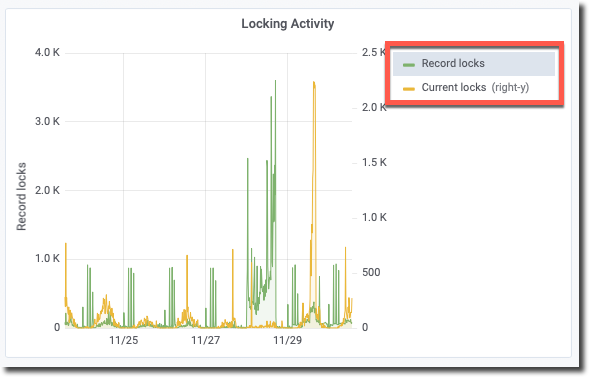
Within this graph, you will see in the legend Record Locks and Current Locks:

Record Locks refer to the rate at which record locks are requested (per second) over the sample period.
Current Locks is the number of lock table entries in use when the sample was taken.
The numbers shown in the graphs do not necessarily represent exact values. The graphing utility does some averaging depending on the breadth of the date range being viewed, and the samples aren't necessarily capturing peak values.
NOTE on -L : Are you trying to determine the correct value for your -L (lock table entries database startup parameter)? Review your actual lock usage found on this ProTop Trends page for a rough range. If you never use more than X, consider using 2 * X rounded upwards. The HWM can be reached between samples and, therefore not necessarily recorded here.
If for some reason, you find that it needs to be higher (lock table overflow and user's transactions are being backed out) it can be changed online with "proutil -C increaseto”. Whatever you settle on, be sure to update -L in your database startup parameter file.
For more information on locks and Lock HWM see this Progress Knowledgebase article.