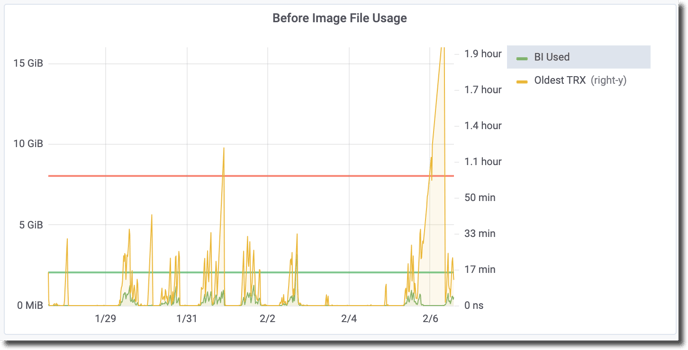
The left axis shows the amount of BI file space used (green line) when the metric sample was taken.
The right-y (yellow line) shows the age of the oldest open database transaction.
The left axis shows the amount of BI file space used (green line) when the metric sample was taken.
The right-y (yellow line) shows the age of the oldest open database transaction.