omSizeConfiguration Viewer (c)
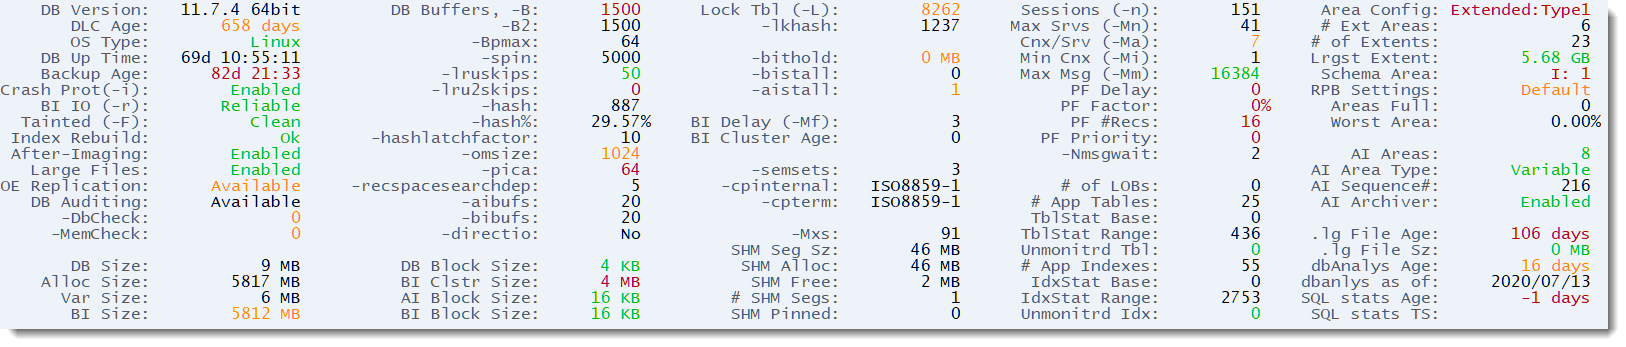
The configuration panel provides a snapshot of the current database configuration. This information is also available on the web in the ProTop Trends dashboard (requires the commercial version of ProTop).
DB Status and Recoverability
| Field | Alertable Metric* | Description |
| DB Version | xdbVersion | Progress OpenEdge version |
| DLC Age | proVersionAge | How long Progress has been installed |
| OS Type | N/A | Operating system type |
| DB Up Time | dbUpTime | Length of time the database has been up |
| Backup Age | dbBkUpAge | String version of the elapsed time since the last full backup using probkup including days i.e. 10d 15:08. Will contain "Never!" if a backup has not occured. Third-party backups, OS backups, and incremental backups are not tracked. |
| Crash Prot (-i) | dbIntegrity | Status of crash protection. (-i) startup parameter |
| BI IO (-r) | biIOMode | Indicates whether or not IO to the BI file is buffered |
| Tainted (-F) | dbTainted | Indicates if entry into the database was forced |
| Index Rebuild | dbIdxBld | Indicates if the index rebuild flag has been raised |
| After-Imaging | afterImaging | Status of after-imaging |
| Large Files | largeFiles | Indicates if the OS has been set to accept files larger than two gigabytes |
| OE Replication | oeReplication | Status of OpenEdge Replication |
| DB Auditing | dbAuditing | Status of database auditing |
| -DbCheck | dbCheck | Indicates if the -DbCheck parameter has been enabled |
| -MemCheck | memCheck | Indicates if the -MemCheck parameter has been enabled |
*Requires data collector "Configuration" in pt3agent.cfg. With the commercial version of ProTop, you can configure alerts using the metric names in this column. For a full list of metrics, see the Alertable Metrics section.
Physical DB Parameters
| Field | Alertable Metric* | Description |
| DB Size | dbSize | Size of the database |
| Alloc Size | N/A | Amount of disk space allocated to the database |
| Var Size | N/A | Size of database variable extent(s) |
| BI Size | biSize | Size of the BI file in MB |
| DB Block Size | dbBlkSize | Database block size in bytes |
| BI Cluster Size | biClstrSize | BI file cluster size in bytes |
| AI Block Size | aiBlkSize | AI file block size in bytes |
| BI Block Size | biBlkSize | BI file block size in bytes |
Important Performance Parameters
| Field | Alertable Metric* | Description |
| DB Buffers, -B | dbBuffers | Size of database server memory buffers in number of memory blocks |
| -B2 | b2 | Size of alternative database server memory buffers in number of memory blocks |
| -Bpmax | bpMax | Maximum total number of client session private buffers |
| -spin | dbSpin | Specifies the number of times a process tries to acquire a latch before pausing |
| -lruskips | lruSkips | The number of times to access a database memory buffer before moving it to the end of the LRU chain |
| -lru2skips | lru2Skips | The number of times to access a database alternative memory buffer before moving it to the end of the LRU chain |
| -hash | hashTbl | The number of hash table entries to use for the buffer pool |
| -hash% | hashPct | The number of hash table entries in the database memory buffers as a percentage of the total number of database memory buffers |
| -hashlatchfactor | hashLatchFact | Number of latches allocated for the Buffer pool Hash Table (BHT) entries as a percent of BHT size |
| -omsize | omSize | Size of the object cache for all database objects |
| -pica | pica | The size of the database service communications area in kilobytes. The database service communications area is used to store after-image block write notifications intended for OpenEdge Replication |
| -respacesearchdep | recSpaceDepth | How deep in the Record Free Chain to search, to find a block with enough free space to fit data, before allocating a new clusters worth of space instead from the Empty Chain where the Area High Water Mark (HWM) is raised |
| -aibufs | aiBuffers | Specifies the number of after-image memory buffers |
| -bibufs | biBuffers | Specifies the number of before-image memory buffers |
| -directio | directio | Whether or not direct IO is enabled. In normal circumstances, it should not be enabled. |
Misc Parameters
| Field | Alertable Metric* | Description |
| Sessions (-n) | N/A | Maximum number of concurrent connections to the database |
| Max Srvs (-Mn) | maxServers | Maximum number of remote client servers that can be started on the system |
| Cnx/Srv (-Ma) | cnxPerServ | Maximum number of remote users per database server |
| Min Cnx(-Mi) | minCnx | Number of remote users on a server before the broker starts another server |
| Max Msg (-Mm) | maxMsg | Specifies the standard message buffer size, in bytes. Message buffers are used to move records between the database an d remote clients (client/server). |
| PF Delay | pfDelay | Enables a delay when sending the first network message for queries with prefetch capabilities |
| PF Factor | pfFactor | Establish the percentage of a network message required to contain prefetched data before sending the message to a wa iting remote client |
| PF #Recs | pfNumRecs | Number of prefetch records to put in a network message before sending the message to a waiting remote client |
| PF Priority | pfPriority | Utilizes a "pollskip" that adds n records to the network message of an in-process prefetch query without additio nal polling |
| -Nmsgwait | nMsgWait | The number of seconds a server waits for a remote network message before checking for other events such as a datab ase shutdown or forced disconnect of a remote client |
Table and Index Range Parameters
| Field | Alertable Metric* | Description |
| # of LOBs | numLOBs | Number of Large Objects defined in the database |
| # App Tables | numTbl | Number of tables defined in the database |
| TblStat Base | tblBase | Lowest file number of files being monitored statistically |
| TblStat Range | tblRange | Highest file number of files being monitored statistically |
| Unmonitored Tbl | UnMonTbl | Number of files not being monitored statistically |
| # App Indexes | numIdx | Number of indexes defined in the database |
| IdxStat Base | idxBase | Lowest index number of indexes being monitored statistically |
| IdxStat Range | idxRange | Highest index number of indexes being monitored statistically |
| Unmonitored Idx | UnMonIdx | Number of indexes not being monitored statistically |
Storage Area Configuration
| Field | Alertable Metric* | Description |
| # of LOBs | numLOBs | Number of large objects in the database |
Parameters Not to be Messed With
| Field | Alertable Metric* | Description |
| Direct IO | directIo | Whether or not direct IO is enabled. In normal circumstances, it should never be enabled. |
| -bistall | biStall | Quiets the database when the recovery log threshold is reached, without performing an emergency shutdown |
| -aistall | aiStall | If all AI files are filled, suspends database activity until an AI extent is emptied |
| BI Cluster Age | biClstrAge | Specifies the number of seconds before OpenEdge reuses a before-image cluster |
| -Bpmax | bpMax | Maximum total number of client session private buffers |
| -DbCheck | dbCheck | Whether Database Consistency Check is enabled. When enabled, this option applies consistency checks to all index blocks and record blocks for record and index write operations. |
Shared Memory Parameters
| Field | Alertable Metric* | Description |
| -Mxs | excessSHM | The value of the shared-memory overflow area. The overflow area is appended to the shared memory area. If the overflow area is too small, the database engine exits. |
| SHM Seg Sz | dbSHMSegSize | Maximum number of bytes in a shared memory segment |
| SHM Alloc | dbSHMSize | Number of bytes allocated to shared memory segments |
| SHM Free | dbSHMFree | Number of bytes available in shared memory segments |
| # SHM Segs | dbSHMSeg | Number of shared memory segments |
| SHM Pinned | dbSHMpinned | Indicates whether or not the database server has requested the operating system to avoid swapping shared memory. Ignored on Windows and AIX. See https//knowledgebase.progress.com/articles/Article/P8856. |
Storage Area Configuration
| Field | Alertable Metric* | Description |
| Area Config | areaConfig | The type of database area configuration. Should be “Extended type 2" |
| # Extent Areas | numAreas | Number of different disk areas holding database extents |
| # of Extents | numExtents | Number of extent files in the database |
| Lrgst Extent | lrgExtent | Size, in bytes, of the largest extent associated with the database |
| Schema Area | N/A | Number of the area containing the schema extent |
| RPB Settings | rpbSettings | Records per block setting |
| Areas Full | N/A | Number of database areas filled |
| Worst Area | worstArea | In areas with fixed extents, the area making the most use of its variable extent |
| AI Areas | aiAreas | Number of After-Imaging areas defined |
| AI Area Type | aiSettings | Types of AI files - Disabled, Fixed, Variable, or Mixed |
| AI Sequence# | aiSeq | Filled AI files since the database server process started |
| AI Archiver | aiArchiver | Status of after-image archive |
Miscellaneous Information
| Field | Alertable Metric* | Description |
| .lg File Age | lgFileDays | Age of the current database log file |
| .lg File Sz | lgFileSize | Size, in bytes, of the current database log file |
| dbanlys Age | dbaAge | Number of days since the last dbanlys was run |
| dbanlys as of | dbaAsOf | Time the last dbanlys was run |
| SQL stats Age | sqlStats | Age of the last run of “UPDATE STATISTICS” |
| SQL stats TS | sqlStatsTS | Date/Time stamp of the last run of "UPDATE STATISTICS" |
*Requires data collector "Configuration" in pt3agent.cfg. With the commercial version of ProTop, you can configure alerts using the metric names in this column. For a full list of metrics, see the Alertable Metrics section.