Here's what the panel looks like in ProTop RT: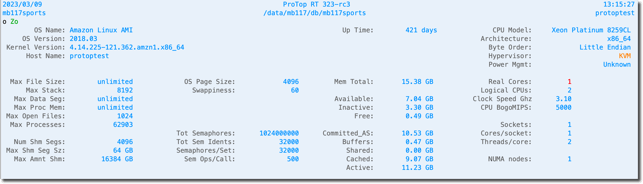
First Column
| ProTop RT Label | Alertable Metric* | Description |
| OS Name | osName | Operating system Name |
| OS Version | osVersion | Operating system version |
| Kernel Version | keVersion | Operating system kernel version |
| Host Name | hostName | Name of server / host ProTop is running on |
| Max File Size | maxFileSz | Operating system limit on any one file size |
| Max Stack | maxStack | Maximum stack size |
| Max Data Seg | maxDataSeg | Maximum data segment size |
| Max Proc Mem | maxProcMem | Maximum memory per process |
| Max Open Files | maxOpenFl | Operating system limit on the number of files opened concurrently |
| Max Processes | maxProcMem | Operating system limit on the number of processes running concurrently |
| Num Shm Segs | SHMMNI | Number of shared memory segments |
| Max Shm Seg Sz | SHMMAX | Maximum shared memory segment size |
| Max Amnt Shm | SHMALL | Maximum amount of shared memory |
Second Column
| ProTop RT Label | Alertable Metric* | Description |
| OS Page Size | N/A | Operating system page size |
| Swappiness | N/A | Current value of the VM Swappiness setting |
| Tot Semaphores | SEMMNS | Total number of semaphores system-wide |
| Tot Sem Idents | SEMMNI | Total number of semaphore identifiers |
| Semaphores/Set | SEMMSL | Maximum number of semaphores per set |
| Sem Ops/Call | SEMOPM | Maximum operations per semop call |
Third Column
| ProTop RT Label | Alertable Metric* | Description |
| Up Time | osUpTime | Days since the server was rebootedDays the server has been up |
| Mem Total | memTotal | Total amount of memory installed on the server |
| Available | memAvailable | Amount of available memory on the server |
| Inactive | memInAct | Amount of inactive memory |
| Free | memFree | Amount of memory currently not in use |
| Committed_AS | memCommtdAS | An estimate of how much RAM you need to make a 99.99% guarantee that there never is OOM (out of memory) for this workload. |
| Buffers | memBufs | Memory buffers in use |
| Shared | memShared | Amount of shared memory |
| Cached | memCached | Amount of cached memory |
| Active | memActive | Current amount of active memory |
Fourth Column
| ProTop RT Label | Alertable Metric* | Description |
| CPU Model | modelCPU | Model name of the CPUs used on this server |
| Architecture | cpuArch | CPU architecture |
| Byte Order | byteOrder | Order or sequence of bytes of a word of digital data |
| Hypervisor | hypervisor | Virtual machine monitor solution |
| Power Mgmt | N/A | Power management |
| Real Cores | cpuCores | Number of physical cores on the server |
| Logical CPUs | logCPUs | Number of logical CPUs |
| Clock Speed Ghz | cpu_clock | CPU clock speed in Ghz |
| CPU BogoMIPS | cpu_bogomips | Measure of CPU speed |
| Sockets | numSockets | Number of sockets |
| Cores/socket | coresPerSocket | Cores per socket |
| Threads/core | threadsPerCore | Threads per core |
| NUMA nodes | numaNodes | Number of NUMA nodes on this server |
*Requires data collector "OSInfo" in pt3agent.cfg. With the commercial version of ProTop, you can configure alerts using the metric names in this column. For a full list of metrics, see the Alertable Metrics section.