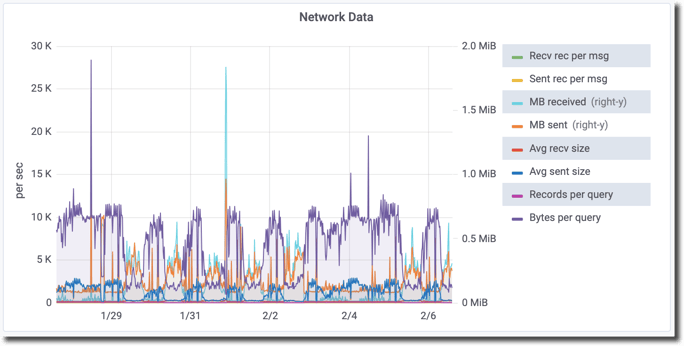
Like the Network Queries, Messages & Records charts but focused on the number of bytes.
“Per query” numbers are not strictly per query – they include bytes sent in non-query messages. This is unfortunate but unavoidable since no metric is available only for query traffic.
These metrics are ”per second”.