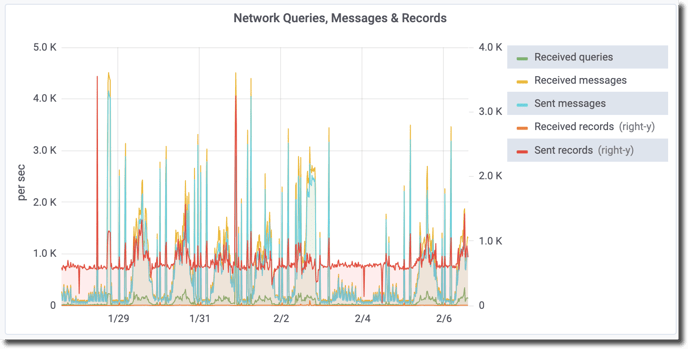
This chart is related to the OpenEdge client-server network messaging protocol.
“Sent” = sent to the server, “received” = received by the client.
“Queries” are FOR EACH NO-LOCK statements that can return a message with multiple records in it.
A “message” is either a request for data, a response to such a request, or control information related to such a request. (A simple FIND statement uses three messages.). “Queries” are counted as a message.
These metrics are ”per second”.