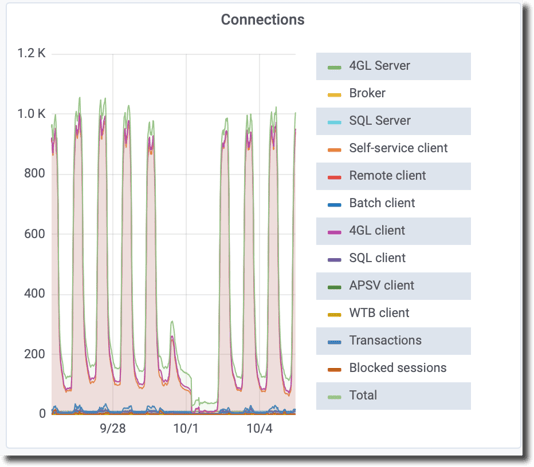
This graph shows various types of connections to this database over time.
NOTE: Any given connection can have multiple properties, so the numbers do NOT add up to the "Total" you see in the chart. For example, a connection with a transaction could be a 4gl, batch, and blocked. It will be counted in all four categories.
These metrics are the simple values at the indicated point in time (not per second or averaged).
| Connection Type | Description |
| 4GL Server | Number 4GL/ABL server connections to the database. |
| Broker | Number of 4GL login brokers running. |
|
SQL Server |
Number of SQL login brokers running. |
| Self-service Client | Number of shared memory connections. |
|
Remote Client |
Number of non-shared-memory connections, or connections coming in over the network (4GL and SQL) |
| Batch Client | Number of 4GL/ABL connections running in batch mode (running with the -b client startup parameter). |
| 4GL Client | Number of 4GL/ABL client connections. |
| SQL Client | Number of SQL client connections. |
| APSV Client | Number of Classic Application Server client sessions (not PASOE, coming soon!). |
| WTB Client | Number of WebSpeed client connections. |
| Transactions | Number of open transactions across all connection types. |
| Blocked Sessions | Number of connections currently blocked from accessing a shared resource. |
| Total | Number of concurrent connections to the database. |