New main dashboard with summary info box
The new main dashboard is a simplified version of the previous version, showing only the most important metrics. A new summary info box shows important metrics and statuses, giving you a quick overview of the health of your database.

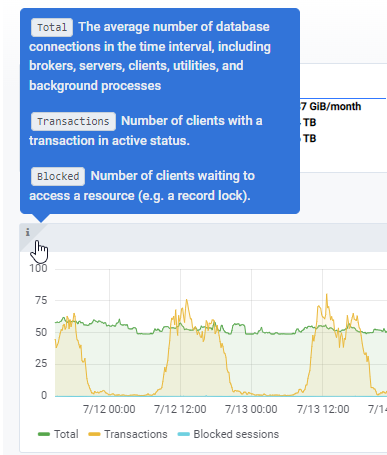
Hover help on panels
Currently found only in the main dashboard (more to come), hover your cursor over the "i" in the upper left corner of a panel and you will see the meaning of the metrics shown in that panel.
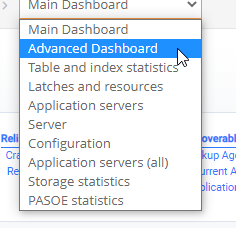
What was the Main Dashboard is now the Advanced Dashboard
The original Main Dashboard, which most users saw when they first arrived at ProTop Trends, was quite densely packed with metric charts. We have renamed that dashboard to be the Advanced Dashboard in the dashboards dropdown list and created a new Main Dashboard with more immediately insightful metric chart panels.
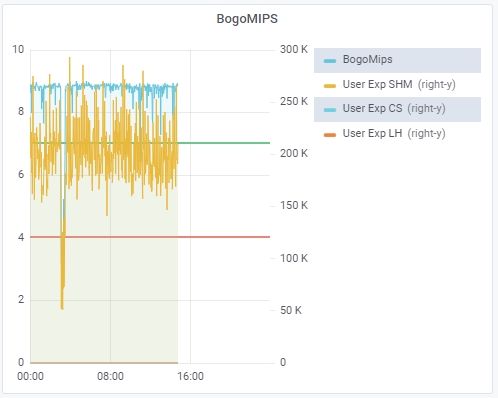
We've new indicators for some of the charts
Wher applicable, panels now show a red and green line, delimiting the zones where a value is considered excellent (green or above), acceptable (between green and red) or bad (below red):
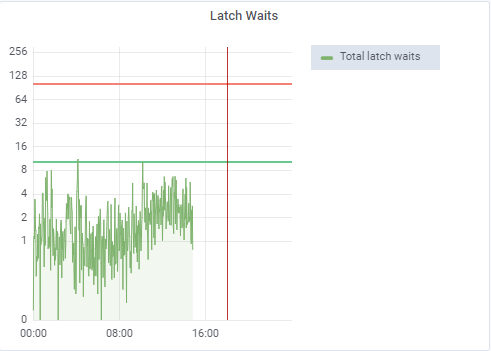
Some panels now use a logarithmic scale
Logarithmic scales are used where applicable to provide a better way of observing wide variations in some values:
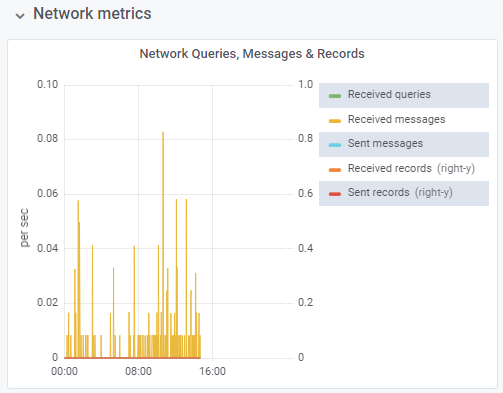
Better naming of axis labels
Some axis labels now better describe what the data represents with terms like "per sec" or "Records read per sec":
Addendum: It has been brought to our attention that due to the introduction of a new dashboard in the list, if you had a default dashboard setup for some resources like for an appserver, the default dashboard may have shifted so that you end up having the wrong default dashboard for this resource. To fix this, you simply have to reselect the correct default dashboard and save it. This bug will be fixed in the next release.
Also, if you do not see the changes, or feel the dashboard selection does not match the displayed dashboard, try refreshing your browser cache (i.e. hitting CTRL-F5 on chrome).