OBJECTIVE: Establish ProTop QAD application monitoring by:
- Replacing the port numbers in $PROTOP/etc/appmon.[customer's QAD app name].cfg with the actual ports running the QAD apps at this site
- Updating $PROTOP/bin/localenv.qad with the correct configuration for this site
- Configuring normal ProTop application monitoring
COMPONENTS INVOLVED:
- QAD apps running at the customer site
- bin/ebdotnet.sh, qxtend.sh, qxo.sh, daemon_check.sh
- bin/localenv.qad
- etc/appmon.[customer's QAD app name].cfg
- etc/alert.[customer's QAD app name].cfg
- etc/pt3agent.[customer's QAD app name].cfg
- etc/dblist.cfg
- Tomcat portal
- /apps/prod/qadee/servers/tomcat-qxtend/webapps/qxi/admin/idle.jsp
Lay the foundation:
1. Pull the current protop-qad (WSS will provide this).
2. Copy the QAD scripts and localenv.qad to $PROTOP/bin
3. Copy the QAD appmon cfg to $PROTOP/etc/appmon.[instanceName_qad].cfg
4. Find the qad app directory:
a. ps -ef | grep qad e.g. ==> /apps/prod/qadee
b. cd /app/prod/qadee
Find and Set the .NET UI Tomcat port
1. Locate the active “connectionManagerConfig.xml" file in the qad app directory:
$ find .  -type f -name “connectionManagerConfig.xml” | grep qadui | grep -v defaults

./servers/tomcat/webapps/qadui/WEB-INF/conf/connectionManagerConfig.xml
2. Find the port for this server in the line in that xml containing "Connection Setup Parameter":
$ grep "Connection Setup Parameter" ./servers/tomcat/webapps/qadui/WEB-INF/conf/connectionManagerConfig.xml

<connectionSetupParameter label="Connection Setup Parameter" uiconfig="false"
value="http://qad-devl:62400/qadui/XMLReceiverServlet"/
<connectionSetupParameter label="Connection Setup Parameter" uiconfig="false"
value="http://qad-devl:62400/qadui/XMLReceiverServlet"/>
4. Edit $PROTOP/etc/appmon.[customer's QAD app name].cfg and replace the port number for ".NET UI" with the above port number.
5. chmod 755 bin/ebdotnet.sh
6. Test the new config by running the script you just updated e.g.:
$ ./bin/ebdotnet.sh localhost 62400 qadui

You should see something like:

$ 0 #### 20221114-100811 Connection Manager has 4 idle sessions on localhost
Configure QXTEND: QXI
1. cd to the qad app directory
2. find the qxtend connector port:
$ find . -name server.xml | grep qxtend
servers/tomcat-qxtend/conf/server.xml

$ grep “Connector port=” ./servers/tomcat-qxtend/conf/server.xml
 <Connector port="62410" protocol="HTTP/1.1" connectionTimeout="20000" compression="on" URIEncoding="UTF-8"/>
        <!-- <Connector port="8443" protocol="org.apache.coyote.http11.Http11Protocol" maxThreads="150" SSLEnabled="true" scheme="https" secure="true" clientAuth="false" sslProtocol="TLS" /> -->
3. Visit the qxtend tomcat portal using IE:
http://qad-devl:62410 > Manager App button on the right >
[usually user=admin pass=mfgpro; if not pull from /apps/prod/qadee/servers/tomcat-qxtend/conf/tomcat-users.xml]
scroll down and click on the qxi link on the left >
Click Managers > Connections > View connection pool
It will look something like this:

4. Verify there is a line for each connection pool (2) in the appmon config file; there are six in this case.
5. Edit $PROTOP/etc/appmon.[instanceName_qad].cfg and replace the port numbers on the lines containing qxtend.sh with the above port number.
6. Test each of the qxtend.sh lines, they should show something like:
$ ./bin/qxtend.sh FACT-Q SIAPI  62410

0 #### 20221114-105612 Connection Manager for FACT-Q SIAPI has 1 idle sessions
Create the non-interactive qxtend qxi status jsp:
1. cd to the qad tomcat qxtend qxi app directory e.g.
$ cd /apps/prod/qadee/servers/tomcat-qxtend/webapps/qxi/admin
2. Make the idle.jsp:
cp -pi ConnectionManagerDetail.jsp idle.jsp
3. edit idle.jsp, find java.util.Iterator connectionInfo = null;
4. add these two lines directly above it so they look like this:
   java.lang.String poolName = request.getParameter("name");
   java.lang.String poolType = request.getParameter("type");
   java.util.Iterator connectionInfo = null;
5. find these lines and comment them out so they look like this:
 // String poolName = poolSettings.getPoolName();
 // String poolType = poolSettings.getPoolType();
6. jump to the end of the file and add <%=idleNum%> above the closing body tag so it looks exactly like this:
<%=idleNum%>

</body>
</html>
WARNING: The 4th line from the bottom must contain %idleNum% when using tail -4 as that is used later to grab the value of idleNum from the output of this .jsp file.
7. Save and exit.
Configure QXTEND: QXO
1. cd $PROTOP/bin
2. Edit qxo.sh and change the includes at the top so they reflect the correct location of the protopenv and localenv.qad files.
3. chmod 755 localenv.qad
4. Visit The qxtend outbound dashboard e.g. http://qad-ee:62010/qxo
5. Identify running Services by expanding each and clicking on the service name. You are looking for running instances to monitor. Not all services will be used by every customer. In this case we have only 1 instance running, for Event Service ES1:
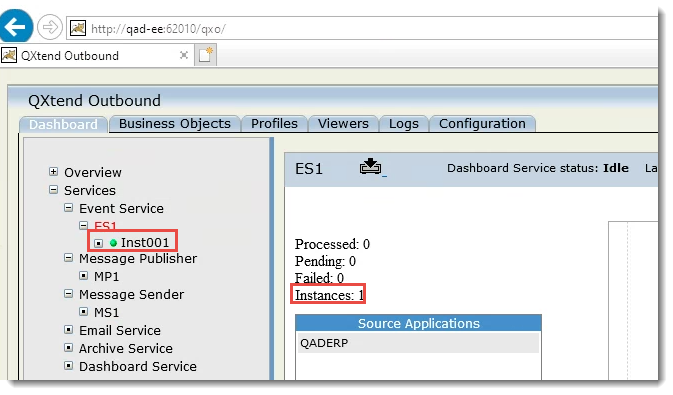
6. Edit $PROTOP/etc/appmon.[instanceName_qad].cfg and verify there is an app definition for each. In this case, we have only one for ES1:
20 "QXO Event Service" "./bin/qxo.sh ES ES1 62010 /apps/devl/qadee/dist/qxoserver/scripts/" "Running,Down,CheckFailed"
7. Set the port accordingly.
8. Correct the script directory reference.
9. Save and exit.
10. Test each script definition from the $PROTOP directory, e.g.:
$ ./bin/qxo.sh ES ES1 62010 /apps/devl/qadee/dist/qxoserver/scripts/

0 #### 20221114-120050 QXO Service: ES ES1 has 1 idle and 1 ACTIVE
QAD Daemons
Check Script
1. cd $PROTOP/bin
2. Edit daemon_check.sh
3. Correct the includes to reflect the location of the protopenv and localenv.qad files.
4. chmod 755 daemon_check.sh
Daemon PROPATH
1. cd the qad apps scripts directory, e.g. /apps/dev/qadee/scripts
2. open one of the daemon start scripts (ls *daemon*start)
3. find the PROPATH line and copy the string between the double quotes.
4. edit $PROTOP/bin/localenv.qad
5. set the Daemon PROPATH to the string you just copied. If configuring more than one qad instance on the same server, add a line: [instanceName_qad]PPATH= and set it to the double-quoted PROPATH string you copied in step 3 above. See the examples at the bottom of the localenv.qad file.
6. Save and exit.
Daemon URL
1. Determine the fin AS port number (e.g. nsman -i NS1_devl -q -port 62490 | grep fin)
2. edit $PROTOP/bin/localenv.qad
3. edit the DMNURL, set port number to the above.
4. Save and exit.
Check all the daemons
1. ps -ef | grep daemon - make note of the running daemons
2. edit $PROTOP/etc/appmon.[instanceName_qad].cfg
3. Verify there is a daemon_check.sh for each of the running QAD daemons discovered above.
4. change the port on each line to the fin AS port discovered above.
5. Save and exit.
Configure ProTop App Monitoring
1. cd $PROTOP/etc
2. edit dblist.cfg
3. add a line similar to this:
[customer's QAD app name] | -1 | qad-devl | no||
4. Save and exit.
5. Test: protop [customer's QAD app name] - use the command key "e" and verify all apps are monitored: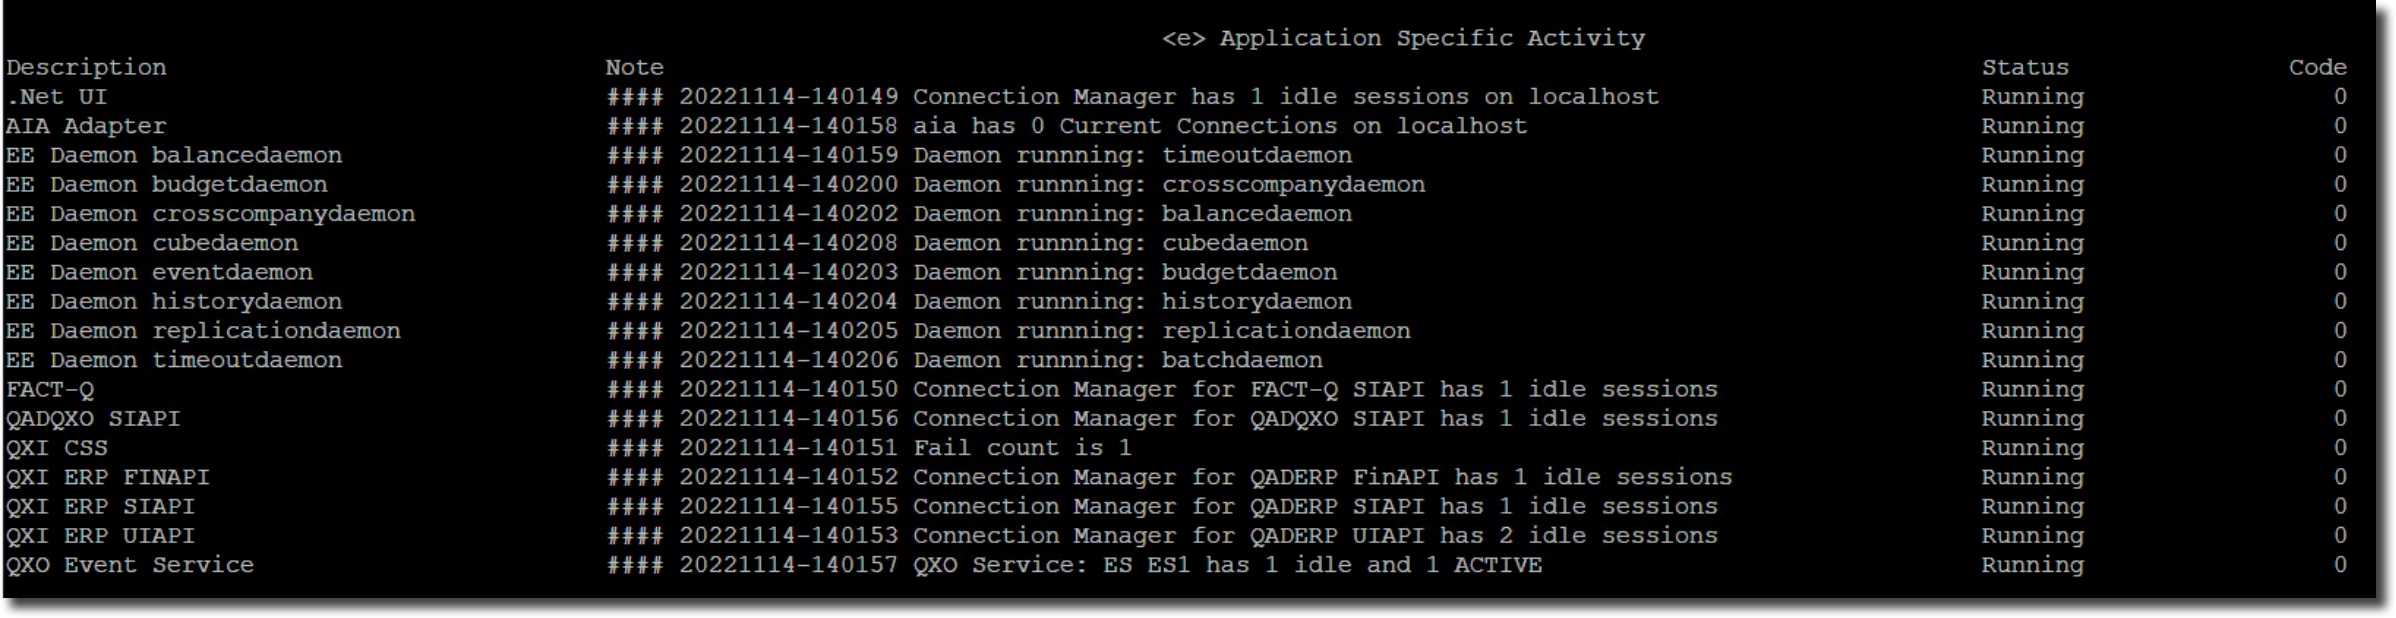
6. cp pt3agent.cfg pt3agent.[customer's QAD app name].cfg
7. Edit pt3agent.[customer's QAD app name].cfg: ptInitDC "appActivity"
8. Set monitored to yes for [customer's QAD app name] in etc/dblist.cfg
9. run syncdblist.sh
10. Create empty etc/alert.[customer's QAD app name].cfg and add alert definitions as required. Here are examples using the two alertable metrics whose values are set by ProTop:
appMonStatus char <> "Running" "" "hourly" "Appmon &2 &3 (&1)" alert
statCode num <> 0 "" "hourly" "Appmon &2 &3 (&1)" alert
11. Test that alerting is working for this resource (e.g. sendalert.sh [customer's QAD app name] -type info -m test -msg "test [customer's QAD app name]")
Can I Monitor Multiple QAD Instances?
1. Yes. Once you have configured all of the ProTop monitoring components for one QAD instance, you can repeat the process for the next instance, Name the appmon cfg file for the qad instance you also want to monitor, like this: etc/appmon.[instanceName_qad].cfg and edit as outlined above.
2. Also, you will need to another <env>PPATH to the bottom of bin/localenv.qad specific to that qad instance.
Troubleshooting
- Verify that the apps you are trying to monitor are reporting in as expected on the receptive tomcat ports. If so, there is an issue with your configuration
- Restart ProTop if necessary