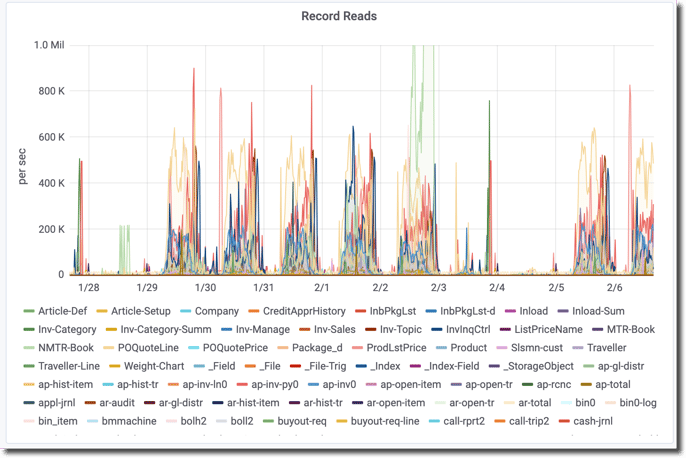
Activity related to specific tables (and indexes). Not all tables and indexes are always shown – there are minimum activity thresholds (set in resource maintenance) to prevent the charts from becoming too busy to be useful.
NOTE: This is an example of the create, read, update and delete charts for tables and indexes found on the "Table and index statistics" trend dashboard (dropdown).
These metrics are ”per second”.