Achieving five nines availability typically requires highly reliable hardware, robust software, redundancy, failover mechanisms, and proactive monitoring and maintenance. It is often a goal for mission-critical systems where downtime can have significant impacts.
Running OpenEdge with After Imaging and OE Replication on highly redundant hardware (e.g., fail-over clusters in geographically disparate locations) plus ProTop Monitoring and Alerting will help you achieve "five nines."
NOTE: System Availability is recorded only for critical resources you designate as such. Indicate that you want a given resource to be included in this system availability dashboard by editing the resource and checking the "Calculate Uptime" box:

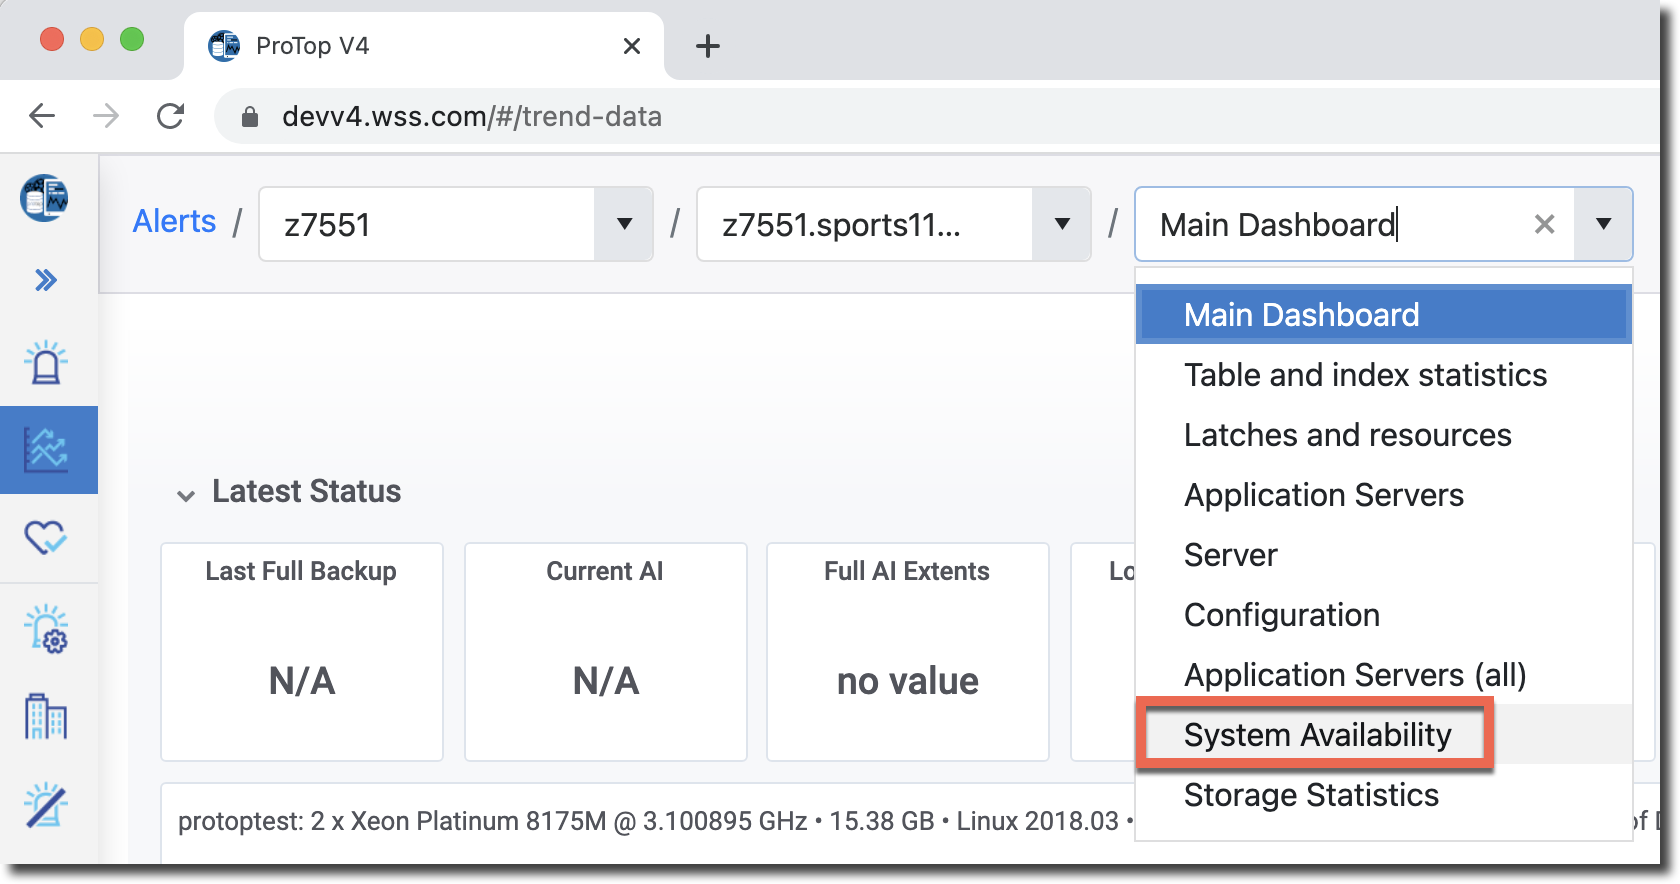
To see the dashboard, head over to ProTop Trends by clicking the Resource name link and selecting System Availability from the dashboards dropdown:
Select the "Unplanned only" checkbox in the upper right to see only surprise outages.
Use the "Combine resources" checkbox to show the uptime for all resources on this site.
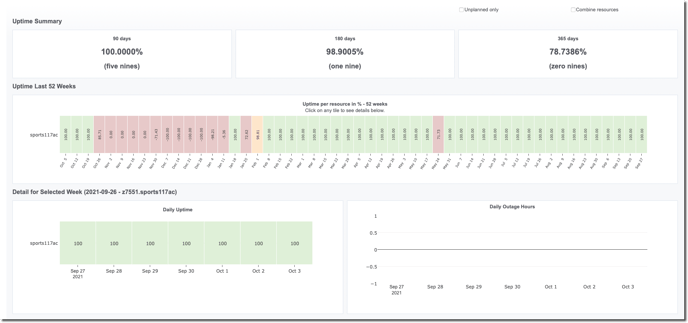
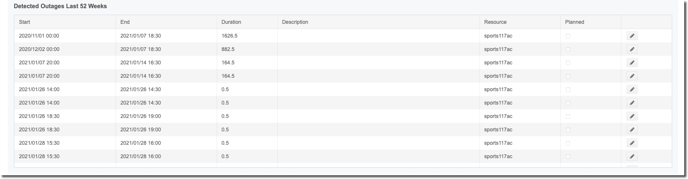
The data is based on past outage data recorded on the ProTop Portal rather than on data recorded in Influx, so you will not find it using Chronograf. The Portal scans the scheduled outage and heartbeat data daily to identify "unplanned" outages.
As you know, every hour a service is unavailable can cost a company millions. Using ProTop Monitoring and Alerting will help you achieve your goal of 99.999% uptime, no sweat!