Classic AppServers and WebSpeed Brokers are available up to and including OpenEdge 11, after which they are replaced by PASOE.
NOTE: Zeros in this panel indicate actual zeros or, an as yet unknown, unknowable, or placeholder value.
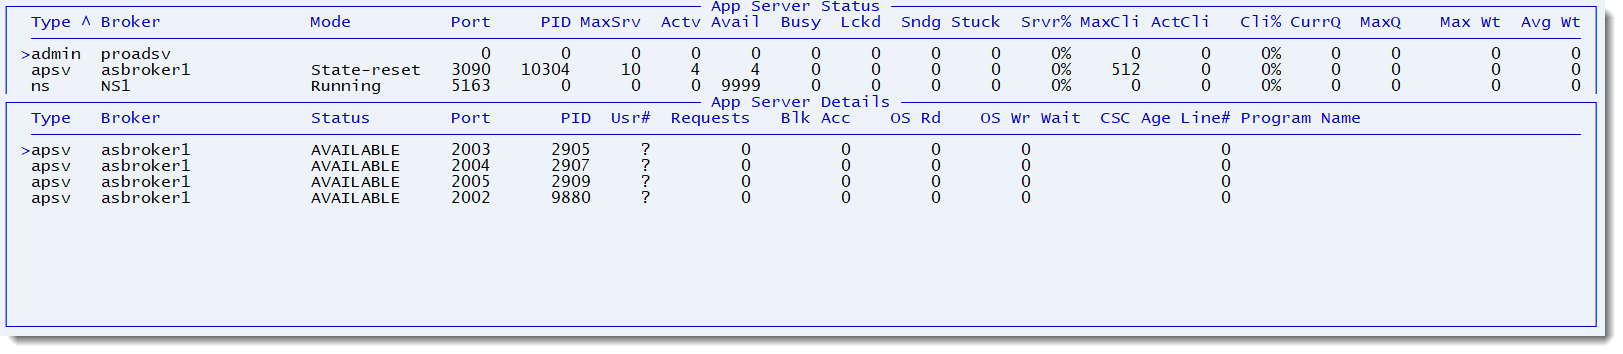
| ProTop RT Label | Alertable Metric* | Description |
| Type | N/A | The type of broker, for example, AdminServer, apsv (AppServer), ws (WebSpeed Broker), etc... |
| Broker | N/A | The name of the broker as defined in ubroker.properties |
| Mode | N/A | Stateless, State-free, State-reset or State-aware |
| Port | N/A | Listening Port Number |
| PID | N/A | Process ID (when known, otherwise 0) |
| MaxSrv | N/A | Maximum number of agents that the broker can start |
| Actv | asActive | Number of running agent processes |
| Avail | asAvail | Number of servers available to service requests |
| Busy | asBusy | Number of busy servers |
| Lockd | asLocked | Number of locked servers |
| Sndg | asSending | Number of sending servers |
| Stuck | asStuck | The number of agents whose status has not changed in the last 'x' minutes, where 'x' is configurable in $PROTOP/bin/localenv via the variable 'APPSRVSTUCK' |
| Srvr% | asSrUsePct | Sum of Busy, locked, and sending agents as a percentage of MaxSrv |
| zasSrInUse | This alertable field is not displayed and contains the sum of busy, locked, and sending agents | |
| MaxCli | asMaxCliInst | Maximum number of client connections permitted |
| ActCli | asActCli | The current number of active client connections |
| zasCliHWM | This alertable field is not displayed and contains the high water mark of connected clients | |
| Cli% | asClUsePct | The number of active client connections as a percentage of the maximum number of client connections allowed |
| CurrQ | asCurrQ | The current request queue length |
| MaxQ | asMaxQ | The high water mark of requests in the queue |
| Max Wt | asMaxWt | The maximum wait time to have a request serviced |
| Avg Wt | asAvgWt | The average wait time for a request |
| asMaxLen | This alertable field is not displayed and contains the maximum time to service a request since the broker was started | |
| asAvgLen | This alertable field is not displayed and contains the average time to service a request |
*Requires data collector "AppSrvStatus" in pt3agent.cfg. With the commercial version of ProTop, you can configure alerts using the metric names in this column. For a full list of metrics, see the Alertable Metrics section.
App Server Details Field Descriptions
| ProTop RT Label | Alertable Metric* | Description |
| Type | N/A | AppServer or WebSpeed Broker |
| Broker | N/A | The name of the broker, as defined in ubroker.properties |
| Status | N/A | Many possible values. The most common are "Available," "Busy," "Locked" and "Sending." |
| Port | N/A | OS port number associated with the application server |
| PID | N/A | The OS process id associated with the application server |
| Usr# | N/A | The database user number associated with the AppServer. Note that the AppServer may not be connected to the monitored database so this value could be "?" |
| Requests | apsvReq | The number of requests made of the application server |
| Blk Acc | apsvDBAccess | Number of database blocks accessed, both reads and writes |
| Os Rd | apsvOSRead | The number of OS reads |
| OS Wr | apsvOSWrite | The number of OS writes |
| Wait | N/A | Lists what the user is waiting for, usually RECord. Followed by flags eXclusive, Queued, and/or Hold |
| CSC Age | N/A | If CSC is enabled, the number of seconds since the user's CSC was last updated |
| Line# | lineNum | If CSC is enabled, the line number of the currently running program |
| Program Name | procName | If CSC is enabled, the name of the currently running program |