Let's get into the details:
Click on any column header to sort entries in that column. Subsequent clicks cycle through default, ascending, and descending order.
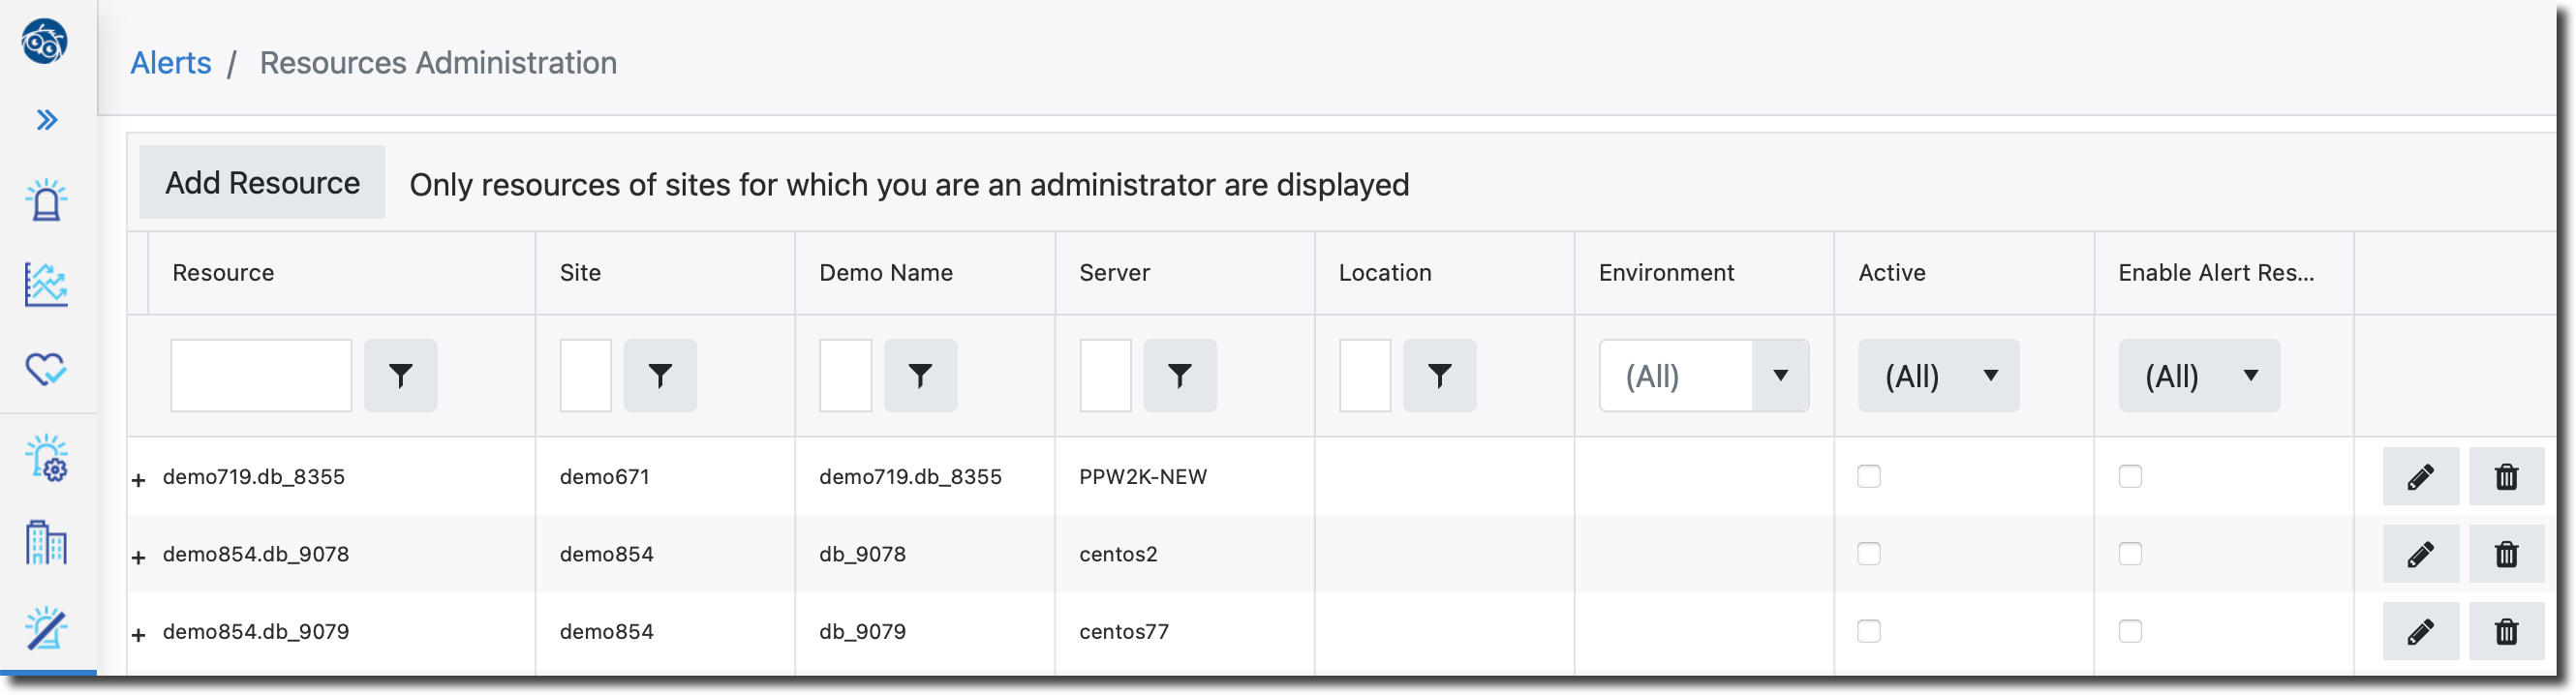
Resource Attribute Columns
| Field | Description |
| Resource | Name of the resource |
| Site | Site name as found in [PROTOPDIR]/etc/custid.cfg |
| Demo Name | Name replacing resource name when running the portal in demo mode |
| Server | The name of the server this resource is running on |
| Location | Physical location of the resource |
| Environment | Describes a group of resources: production, test, development, and so on |
| Active | Enabled - yes/no |
| Enable Alert Responses | Allow sending messages downstream via Alert Response configuration |
| Pencil Icon | Select this button to edit a resource |
| Trashcan icon | Select this button to delete a resource record permanently |
Edit a Resource
Select the pencil icon button near the end of a resource line to edit it. It will be replaced by a diskette icon for saving your changes. And it swaps the trashcan icon with a slash circle icon to use for abandoning your changes.
When a resource is selected for editing, fields are rendered and editable depending on Type:
| Field | Description |
| Demo Name | Name of resource in Demo mode |
| Server | Name of the host running this resource |
| Location | The physical location of the resource |
| Environment | One of DEV, TEST, QA, REPL, PROD or OTHER |
| Active | Is this resource in active use (being monitored) |
| Enable Alert Responses | Send out alarm and page messages for this resource |
| dbPath | If the resource is a database, the absolute path to the database |
| DLC | Absolute path to Progress software |
| Trend Thresholds: CUD | Show tables in the trends portal with create, update or delete counts higher than this |
| Trend Thresholds: OS Reads | Show tables in the trends portal with OS reads higher than this |
| Trend Thresholds: Reads | Show tables in the trends portal with read counts higher than this |
| Trend Thresholds: Churns | Show tables in the trends portal with churn higher than this |
| Agent | The shared agent monitoring this resource; if listed, the named agent monitors more than one OE component, reducing ProTop overhead |
| Group | User-defined. Synced with the "type" column in etc/dblist.cfg |
| HB Check | Interval, in minutes, between heartbeat checks |
| Calculate Uptime | Considered this resource when calculating "5-nines" style uptime metrics |
| Default Chart | ProTop Trends page that gains focus when selecting the current resource |
| Type | Tells the agent to use a common "type" configuration file. *See A Note on Resource Type below |
| Description | Displayed as a tooltip when hovering over a resource name in the Alerts Dashboard |
| Code Path | See Resource Specific PROPATH |
*A Note on Resource Group
This column allows admins to create groups of resources that might have common .cfg files on the agent side. So, for instance, you might want to have a different set of alert thresholds for replication targets. So you could create that grouping by putting “repltgt” in the "type" (aka group) column of the relevant resources in etc/dblist.cfg. Then, when the agent runs for one of those resources, it will look for etc/alert.repltgt.cfg and, if found, it will use that config rather than the default alert.cfg. See Configuration File Hierarchy for more information.
Add Resource Button
When the Add Resource Button is selected, a popup window appears, allowing the user to add a resource record:
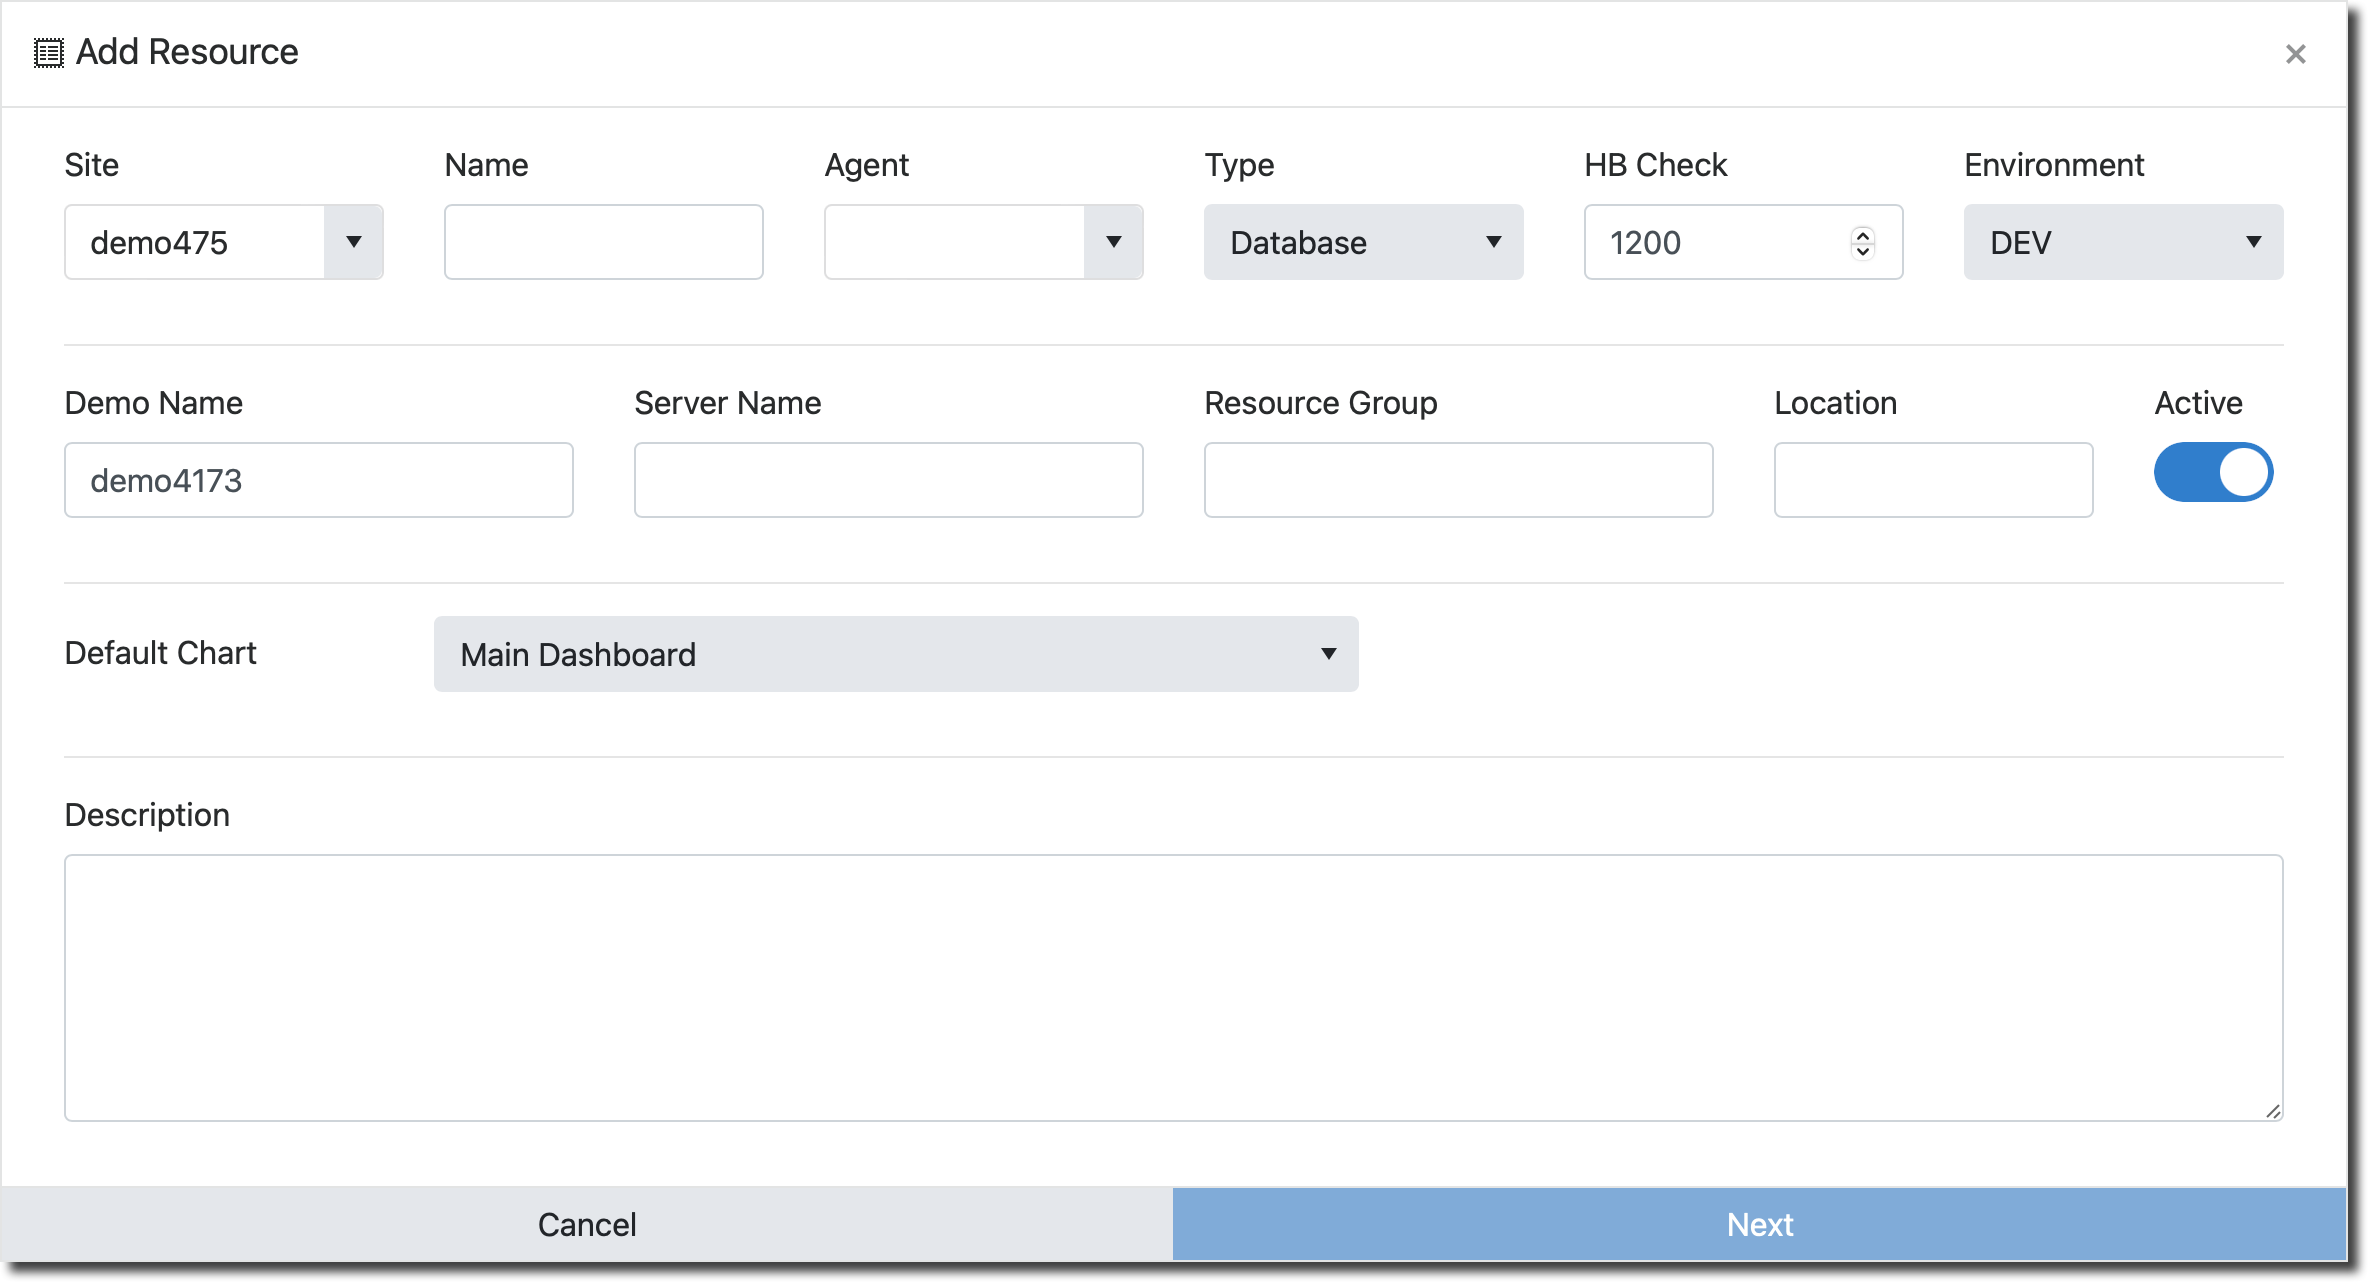
| Field | Description |
| Site | Site name as found in [PROTOPDIR]/etc/custid.cfg |
| Name | Resource name |
| Agent | The shared agent monitoring this resource; if listed, the named agent monitors more than one OE component, reducing ProTop overhead |
| Type | See the table at the bottom of the page * |
| HB Check | Interval, in minutes, between heartbeat checks |
| Environment | Describes a group of resources: production, test, development, and so on |
| Demo Name | Name replacing resource name when running the portal in demo mode |
| Server Name | Host designation for the machine resource inhabits |
| Resource Group | User-defined. Synced with the "type" column in etc/dblist.cfg |
| Location | The physical location of the resource |
| Active | Indicates the resource is being monitored (checked) or not |
| Default Chart | Initial ProTop Trends Dashboard page that renders for this resource |
| Description | Displayed as a tooltip when hovering over a resource name in the Alerts Dashboard |
Next Button (Visible only when adding a database or "OEDB" type resource as in our example above)
A popup window appears, allowing the user to add database-specific attributes:
| Field | Description |
| Code Path | See Resource Specific PROPATH |
| DB Path | If the resource is a database, the absolute path to the database |
| CUD | Show tables in the trends portal with Create, Update, or Delete counts higher than this |
| OS Reads | Show tables in the trends portal with OS reads higher than this |
| Reads | Show tables in the trends portal with reads higher than this |
| Churns | Show tables in the trends portal with churn higher than this |
* Resource Types
| Field | Description |
| AdminServer | Typically used with OpenEdge Explorer or OpenEdge Management |
| Application | Generic interface allowing ProTop to monitor pretty much anything |
| Classic AppSrv/WS | Progress classic application server or WebSpeed |
| Database | Progress OpenEdge database |
| NameServer | Works alongside the AdminServer above |
| Operating System | Server operating system: Windows, Linux, or UNIX |
| PASOE | Pacific App Server |