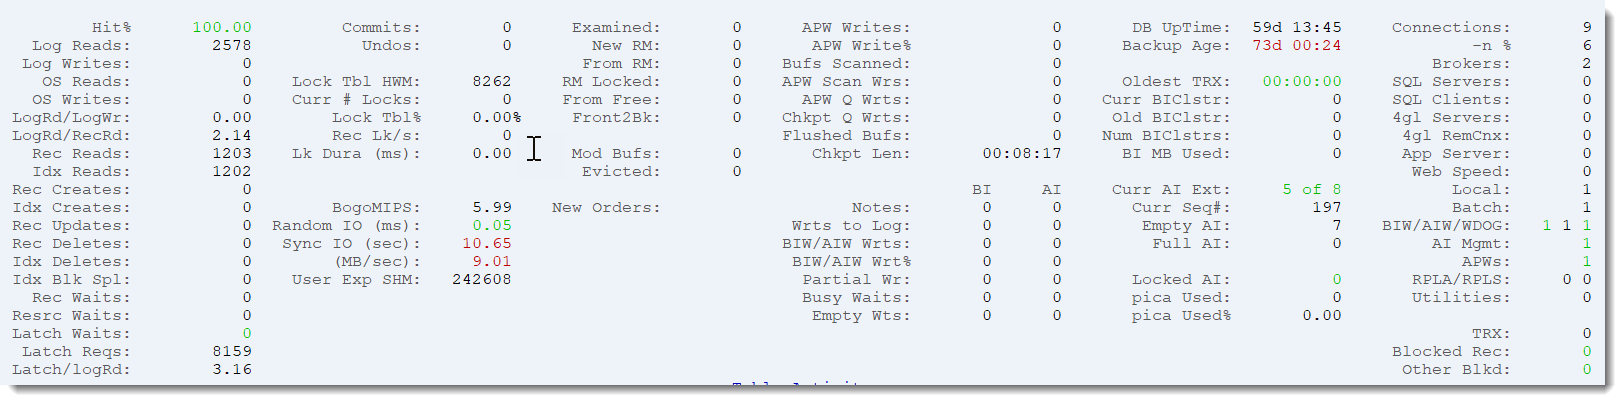
The dashboard panel is a high-level view of some of the more important metrics of a running database. Here you'll find information on database activity (reads, writes, etc...), connections (brokers, servers, users, AppServers, etc...) and so much more.
Remember that the values displayed are typically rates, expressed as values per second. If you prefer to see raw numbers, see the page on switching between raw and rate sampling.
This information is also available on the web in the ProTop Trends dashboard (requires the commercial version of ProTop).
Activity
| ProTop RT Label | Alertable Metric* | Description |
| Hit% | HR | Percentage of database reads read from the database buffer cache |
| Log Reads | logRd | Number of logical record reads |
| Log Writes | logWr | Number of logical record writes |
| OS reads | osRd | Number of reads from disk |
| OS writes | osWr | Number of writes to disk |
| LogRd / LogWr | N/A | Ratio of logical reads to logical writes |
| LogRd / RecRd | N/A | Ratio of logical reads to records reads |
| Rec Reads | recRd | Number of records reads |
| Idx Reads | idxRd | Number of index reads |
| Rec Creates | recCr | Number of records creates |
| Idx Creates | idxCrx | Number of index creates |
| Rec Updates | recUp | Number of records updates |
| Rec Deletes | recDl | Number of records deletes |
| Idx Deletes | idxDlx | Number of index deletes |
| Idx Blk Spl | idxBlkSplit | Number of index block splits |
| Rec Waits | recWt | Number of processes waiting for records |
| Resrc Waits | resrcWt | Number of processes waiting for an internal database resource |
| Latch Waits | latchTMO | Number of processes waiting for a latch to access information in shared memory |
| Latch Reqs | latchReq | Number of latch requests |
| Latch / logRd | N/A | The ratio of latches requests to logical reads |
| Commits | trx | Number of transactions commits |
| Undos | trxUndo | Number of transactions undos |
Insights to Activity
Hit%: This is the most used and abused metric in the database world. To be blunt, anything under 99% is bad. Let me explain:
If you have a 99% hit ratio, then one in every 100 database reads is not found in the buffer cache, forcing a read from disk. If the buffer hit ratio is 98%, this means there were two disk reads for every 100 logical reads. This is 100% worse than a 99% buffer hit percentage (i.e. twice as bad). It is not 1% worse.
There are all kinds of benchmarks out in the GoogleSphere talking about small random IOs that are typical of database accesses. Any way you slice it, a disk request will be thousands of times slower than a cache hit, and I don't care what your SAN vendor told you about his super-incredible-all-flash storage subsystem.
99% or bust !!
LogRd / RecRd: Normally, this should be a little more than 2, as each record read usually involves a read from an index block that contains the ROWID of the record and then the actual read of the data from the data block. The little more comes from associated reads like the template record and the traversal of the index from the root, through the branches, and finally to the leaf node.
Confused? Ask the experts.
Locks
| ProTop RT Label | Alertable Metric* | Description |
| Lock Tbl HWM | lkTblHWM | Lock table concurrent locks high water mark. This is the highest number of concurrent record locks since the database was started or statistics were zeroed |
| Curr # Locks | currLks | Current number of record locks |
| Lock Tbl % | lkTblpct | Current number of locks as a percentage of the highest allowable number of entries in the lock table (-L startup parameter) |
| Rec Lk/s | N/A | Record locks per second |
| Lk Dura (ms) | lkDurMS | The average duration of a lock in milliseconds |
System Metrics
| ProTop RT Label | Alertable Metric* | Description |
| BogoMIPS | bogoMips | BogoMIPS measures the single-threaded performance of a 4GL client |
| Random IO (ms) | ioResponse | The time it takes to perform a random rea from a database file that is not in memory |
| Sync IO | synchIO | Time required to grow a bi file to 96 MB on the BI file system |
| (MB/sec) | synchIOMb | Sync IO time presented in MB/sec |
| User Exp SHM | usrExpSHM | Shared memory 4GL client db reads/second |
| User Exp LH | usrExpLH | Client/server 4GL client reads/sec, connecting via the localhost connection (not shown - part of commercial ProTop) |
| User Exp CS | usrExpCS | Client/server 4GL client reads/sec, connecting via across the LAN from another server (not shown - part of commercial ProTop) |
Insights to System Metrics
BogoMIPS is the measure of single-threaded performance when running 4GL code. Higher numbers are better. Values of 6 and up mean the server is running on modern Intel Xeon CPUs (as of 2020) or comparable, 4-6 are older CPUs. Anything under 4 is old and slow.
We also expect the value to be consistent: if it's 5.2, then it should be around 5.2 all the time. If you see wild swings in bogoMIPS then it could be an indicator that your CPUs are over-burdened. If top/topas/nmon/glance (UNIX) or Performance Monitor (Windows) insists that your server is not using a lot of CPU, then a wildly varying bogoMIPS could point to an overprovisioned hypervisor.
Sync IO: Numbers greater than 10 are concerning. Numbers much greater than 10 are an indicator of a major disk subsystem problem.
How long can you freeze writes to the database before people notice? Our rule-of-thumb is 2 seconds. When the BI file needs to grow by one cluster, writes to the database are frozen. So what's your BI cluster size? Values of 8MB - 64MB are common. In our screen shot at the top of this page, we see that we can grow the BI file at 7.83 MB per second. If your BI cluster size is 8 MB or 16 MB, then probably no one will notice. If it's 64 MB, then all writes to the database will freeze for 64 / 7.83 = 8.17 seconds while the BI file expands by one cluster. I think your users will notice that.
But be careful! The easy answer is not necessarily to shrink your BI cluster size. You want your shortest checkpoints to last at least 30 seconds to give all the moving parts time to catch up (fish around our blog page for articles on BI cluster size). Shrinking your BI cluster size might simply be trading one performance problem for another.
With the commercial version of ProTop, we trend these metrics over years so that you can easily see when and how changes in infrastructure affected your OpenEdge systems.
Confused? Ask the experts.
RM Chain Activity
| ProTop RT Label | Alertable Metric* | Description |
| Examined | rm_examined | Number of RM blocks examined to see if space is available |
| New RM | rm_allocNew | Number of new blocks created in the RM chain |
| From RM | rm_fromRM | Number of blocks allocated from the RM chain |
| RM Locked | rm_rmlocked | Number of blocks locked |
| From free | rm_fromFree | Number of blocks allocated from the Free chain |
| Frnt2Bk | rm_frnt2bk | Number of blocks moved from the front of the chain to the back because not enough space was available |
| Mod Bufs | modbufs | Number of modified buffers |
| Evicted | evictbufs | Number of blocks evicted from the RM chain |
Insight into the RM Chain
The Record Manager (RM) chain is a linked list of pointers to data blocks containing space for new records. In a type 2 storage area each object has its own RM chain, so when a new record is added, for example, the DB manager first searches the RM chain, looking for a block with sufficient space to hold the new record. By default, up to 5 blocks on the chain will be examined before the inserting process gives up and allocates a new block (see the recspdepth parameter in the configuration screen).
Custom Application Metrics
| Metric | Description |
| New Orders | Placeholder for user-defined metrics. See Custom Application KPIs. |
What are Custom Metrics?
With the commercial version of ProTop, you can write your own Key Performance Indicators (KPI) and have them appear both in the Real-Time monitor and in the web portal. For example, you may wish to track the number of orders processed or the number of widgets manufactured so that you can correlate business activity against database activity. ProTop supports up to 8 such Custom Application KPIs.
Asynchronous Writers
| ProTop RT Label | Alertable Metric* | Description |
| APW Writes | apwWrts | Number of APW writes |
| APW Write% | apwWrtPct | Percentage of database buffer block writes performed by APW |
| Bufs Scanned | apwBufsScan | Number of database buffers scanned |
| APW Scan Wrs | apwSanWrts | Number of scanned database buffers written |
| APW Q Wrts | apwQueWrts | APW queue writes |
| Chkpt Q Wrts | apwChkPtWrts | Checkpoint queue writes |
| Flushed Bufs | bufsFlushed | Number of database buffers flushed to disk at the end of the most recent checkpoint |
| Chkpt Len | minChkPtLen | Length, in HH:MM:SS, of the shortest checkpoint since the beginning of the ProTop session |
AI/BI Activity
| ProTop RT Label | Alertable Metric* | Description |
| Notes | biNotes | Number of notes written to the BI log / AI log |
| Wrts to log | biNotes | Number of notes written to the BI log / AI log |
| BI/AI Wrts | biWrts | Number of notes written to the BI file / AI file |
| BI/AI Write% | biwWrtPct | Percentage of BI / AI notes written by BIW / AIW |
| Partial Wr | biPartWrt | BI / AI blocks written, not because they are full but because they have been in memory over n seconds (default 3). |
| Busy Waits | biBusyWt | Number of times a process waited because the BIW / AIW was busy. Non-zero is normal. |
| Empty Wts | biEmptyWt | Number of times a process waited for an empty BI / AI buffer. Should always be zero. |
DB Status and Recoverability
| ProTop RT Label | Alertable Metric* | Description |
| DB UpTime | dbUpTime | Length of time since the database server process started |
| Backup Age | dbBkUpAge | String version of the elapsed time since the last full backup using probkup including days i.e. 10d 15:08. Will contain "Never!" if a backup has not occured. Third-party backups, OS backups, and incremental backups are not tracked. |
| Oldest TRX | OldTRX | Age of the oldest open transaction |
| Curr BIClstr | currBI | Current BI cluster in use |
| Old BIClstr | oldBI | Oldest BI cluster in use |
| Num BIClstrs | numBI | Number of BI clusters in use |
| BI MB Used | biUsed | Megabytes of BI file in use by BI clusters |
| Curr AI Ext | ai_Curr | AI extent number of the currently busy AI extent |
| Curr Seq# | ai_Seq | AI sequence number of the currently busy AI extent |
| Empty AI | ai_Empty | Number of AI extents empty and available |
| Full AI | ai_Full | Number of full AI extents awaiting archiving |
| Locked AI | ai_Locked | Number of locked AI extents (only useful with OpenEdge Replication) |
| pica Used | picaUsed | Number of Replication message entries in use. |
| pica Used% | picaUsedPct | Percent of total Replication message entries in use. |
Recoverability Insight
BI MB Used: The physical size of the BI file(s) does not offer any insight into the actual amount of BI space used. A 10 GB BI file does not mean that you are actively using 10 GB of BI. ProTop calculates the actual number of BI clusters in use in order to calculate the effective size of the BI file.
Full AI Extents: Filling all AI extents has two rather unfortunate implications: if the AI extents are fixed in size, the database will crash, or at least stall if the -aistall parameter is in effect. More stealthily, online backups will fail as these require an AI file switch, impossible if there are no empty AI extents available. More often than we can count, we've come across situations where database backups have failed for weeks without anyone noticing.
OpenEdge Replication: OER adds another level of risk that must be mitigated: locked AI extents and full pica buffers. The DB Service Queue (commonly called the pica buffer because of the -pica startup parameter) contains pointers to AI notes in the AI files that have not yet been replicated to the target database(s). If the DB Service Queue fills, modifications to the database are halted until space becomes available. Additionally, full AI files cannot be cleared for reuse as long as they contain AI notes that have not yet been replicated, potentially leading to the same situation as the "all full" AI extents mentioned in the previous paragraph.
The commercial version of ProTop monitors all of these important metrics automatically.
Still confused? Ask the experts.
Connection Information
| ProTop RT Label | Alertable Metric* | Description |
| Connections | con_Total | Number of connections to the database |
| -n % | dashNpct | Number of connections to the database as a percentage of maximum number of connections as set during database server startup (-n) |
| Brokers | con_Brok | Number of Broker processes |
| SQL Servers | con_SQLServ | Number of SQL Server processes |
| SQL Clients | con_SQL | Number of SQL client processes |
| 4gl Servers | con_4glServ | Number of 4GL Server processes |
| 4gl RemCnx | con_Remc | Number of remote client / server connections |
| App Server | con_APSV | Number of App Server connections |
| Web Speed | con_wta | Number of Web Speed connections |
| Local | con_Self | Number of connections using shared memory |
| Batch | con_Batch | Number of batch processes |
| BIW/AIW/WDOG | con_BIW | Values of 0 or 1 indicate the existence [1] or not [0] of the BI writer process, AI writer process and Watchdog process |
| AI Mgmt | con_aimd | Value of 0 or 1 indicates the existence [1] or not [0] of the AI File Management Daemon process |
| APWs | con_APW | Number of Asynchronous Page Writers |
| RPLA/RPLS | con_rpla | Number of OpenEdge Replication Agents (possible values are 0, 1 or 2) and OpenEdge Replication Servers (0 or 1) |
| Utilities | con_Util | Number of database utilities, such as promon or proutil running |
| TRX | con_TRX | Number of open transactions |
| Blocked rec | con_BlockRec | Number of users blocked waiting for a record |
| Other Blkd | con_Block | Number of users blocked for any reason other than waiting for a record (ex.: latch) |
Helper Processes:
AIW and BIW: These processes read AI or BI buffers from memory and write them to disk. However, it is not true that they are responsible for 100% of AI/BI writes. Any process, in order to respect WAL (Write-Ahead Logging), may execute an AI or BI buffer write.
WDOG: The watchdog scans the user table for local processes and checks to see if the associated PID still exists. If not, it assumes the cleanup duty for the vanished process, undoing open transactions, freeing up resources, etc.
AIMGT: The AI File Management Daemon is responsible for rotating and archiving AI files. It relies on the values of -aiarcdir (AI Archive Directory) to know where to archive full AI files, and, optionally, -aiarcinterval (AI Archive Interval), to know at what frequency to rotate AI files. If -aiarcinterval is not set, the presumption is that the AI files are of fixed size and the AIMGT archives them when they fill.
Insight into Connection Information
AIW/BIW/WDOG and AIMGT: each database can only have 0 or 1 of these helper processes. We strongly recommend 1 over 0!
APW: While it is possible to start more than 1 APW, 99% of databases should not require more than 1. If you really think that you need 2 or more, share your use case on ProTop Community. We might agree with you, but we probably won't. At the very least, we'll be happy to explain why.