It includes 18 graphs, the first three of which are shown here. All 18 charts are described below.
General Info Graphs
These graphs give an overall view of connection information and the performance of the underlying infrastructure from a uniquely OpenEge ABL perspective. See the Dashboard View page for descriptions and in-depth discussions on the metrics in these panels.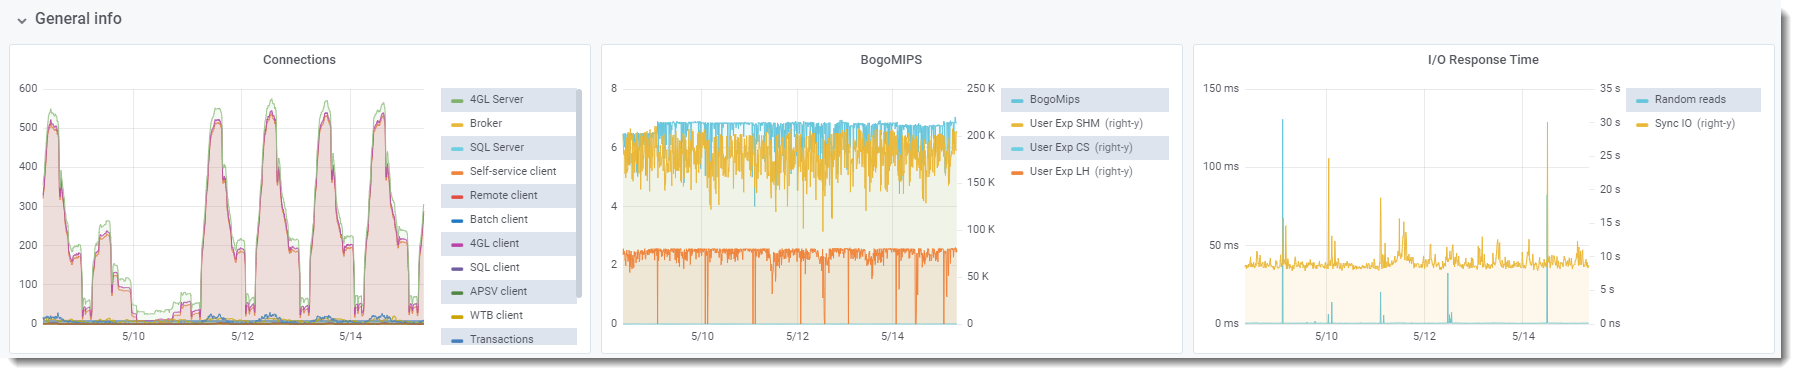
Database IO Graphs
These graphs show the interplay of logical versus physical reads and writes, as well as the hit ratio and the logical-to-record read ratio. See the Dashboard View page for descriptions and in-depth discussions on the metrics in these panels.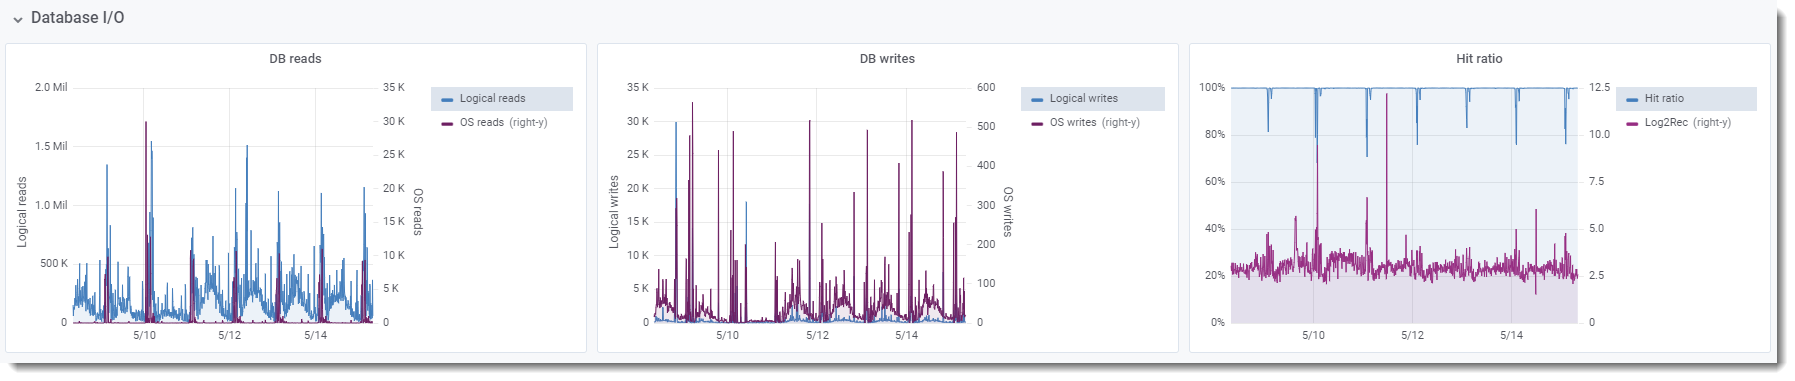
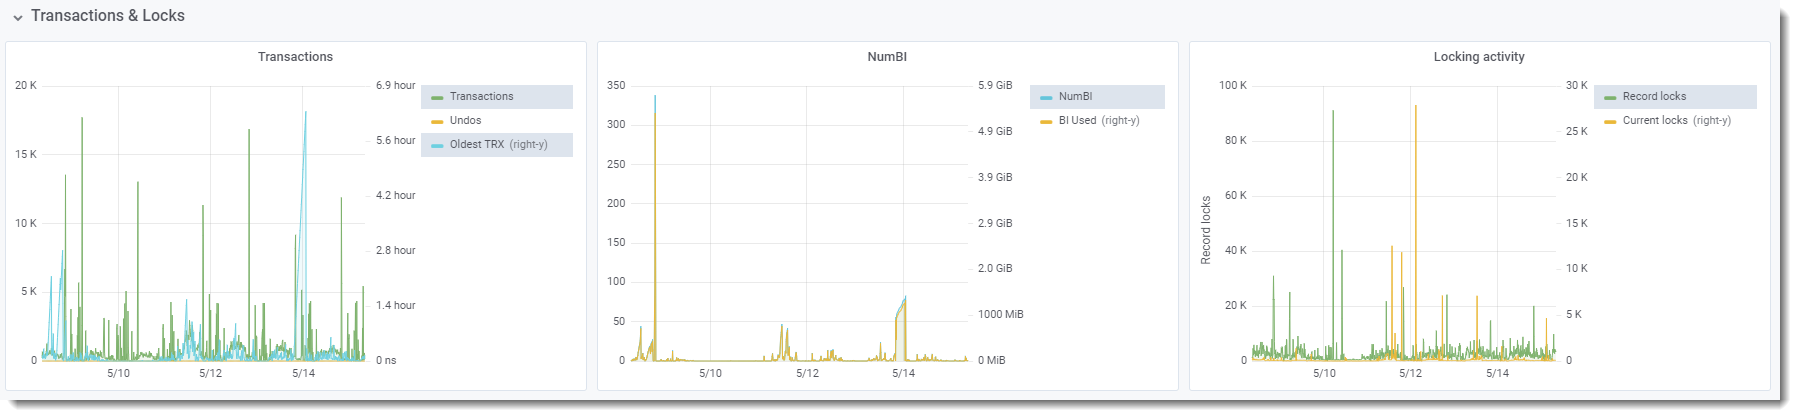
Transactions and Locks Graphs
These graphs provide detailed historical data on transactions, record locking, and BI activity. See the Dashboard View page for descriptions and in-depth discussions on the metrics in these panels.
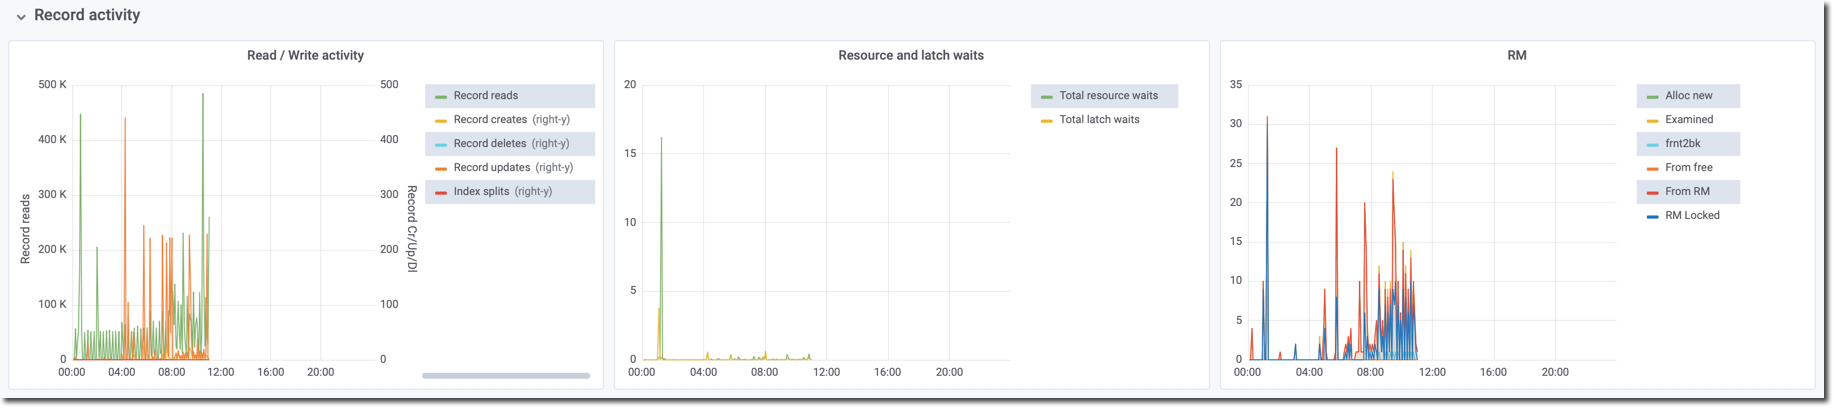
Record Activity
These graphs show detailed historical data for Record Read/Write, (database internal) Resource and Latch Wait and RM chain activity. See the Dashboard View page for descriptions and in-depth discussions on the metrics in these panels.
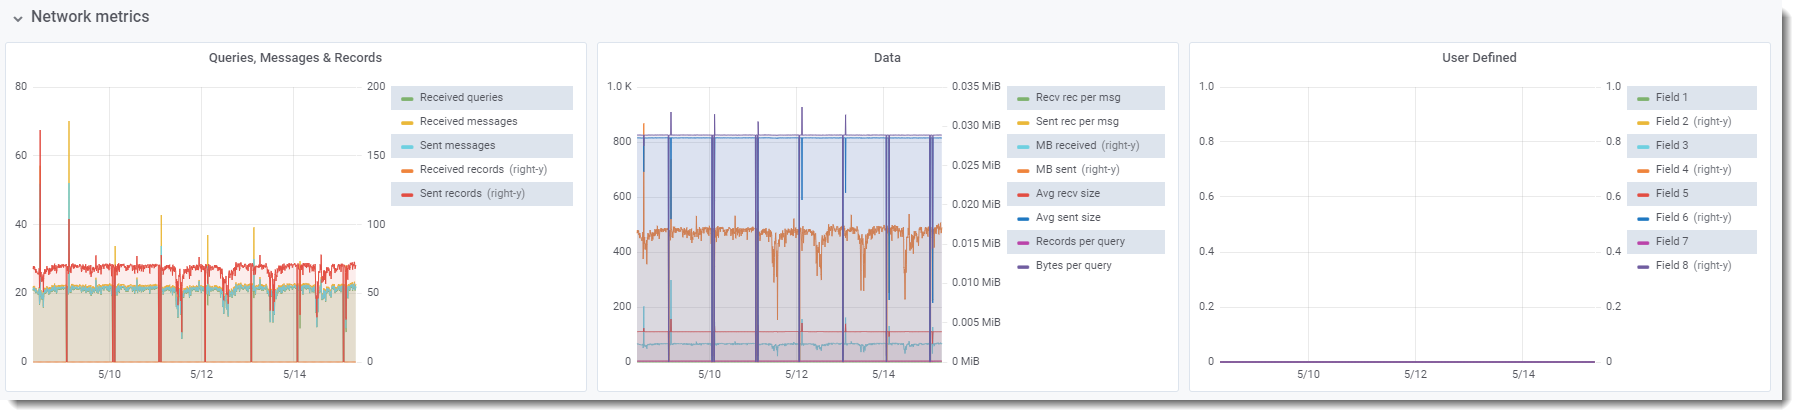
Network Metrics
These critical metrics show how efficient data transport is across the network for applications that query the database across a client-server connection. Please see at the Server Activity page for descriptions and in-depth discussions on the metrics in these panels.
The third graph, "User Defined," allows customers of the commercial version of ProTop to track up to 8 application KPIs and correlate that data against database activity. Please see the Dashboard View page for a description of custom metrics.
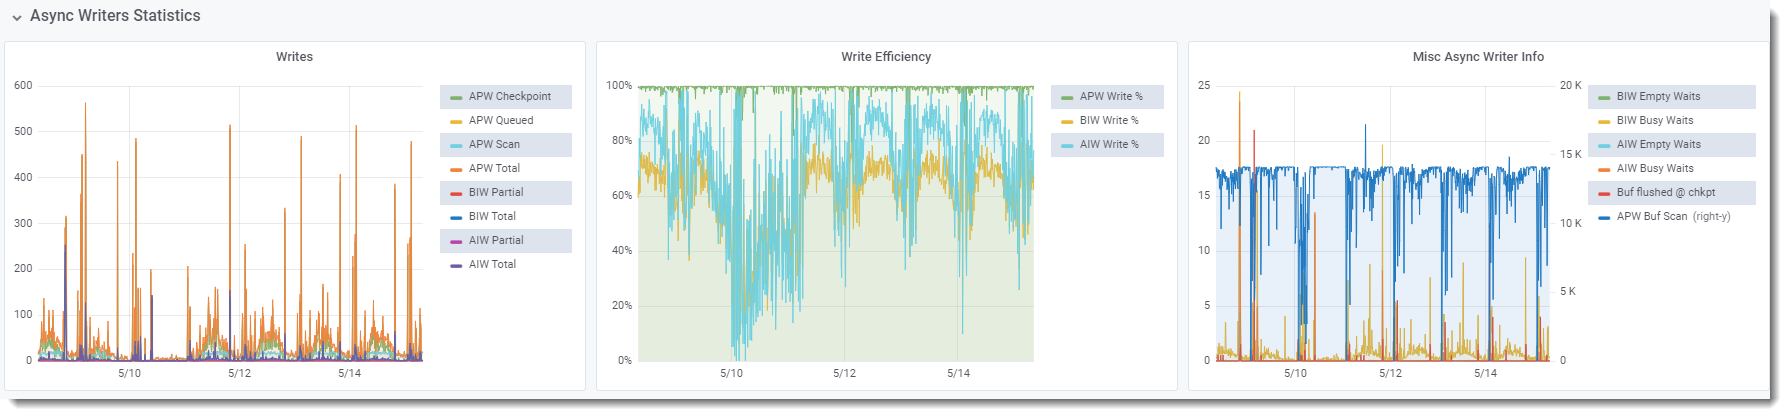
Async Writer Statistics
The Enterprise Database product includes several helper processes designed to offload IO tasks from the broker and other users. See at the Dashboard View page for descriptions and in-depth discussions on the metrics in these panels.