Table read activity
These graphs show table read activity for active tables in the database. Prevent cluttering the charts by setting minimum activity thresholds defined in the Resources Administration.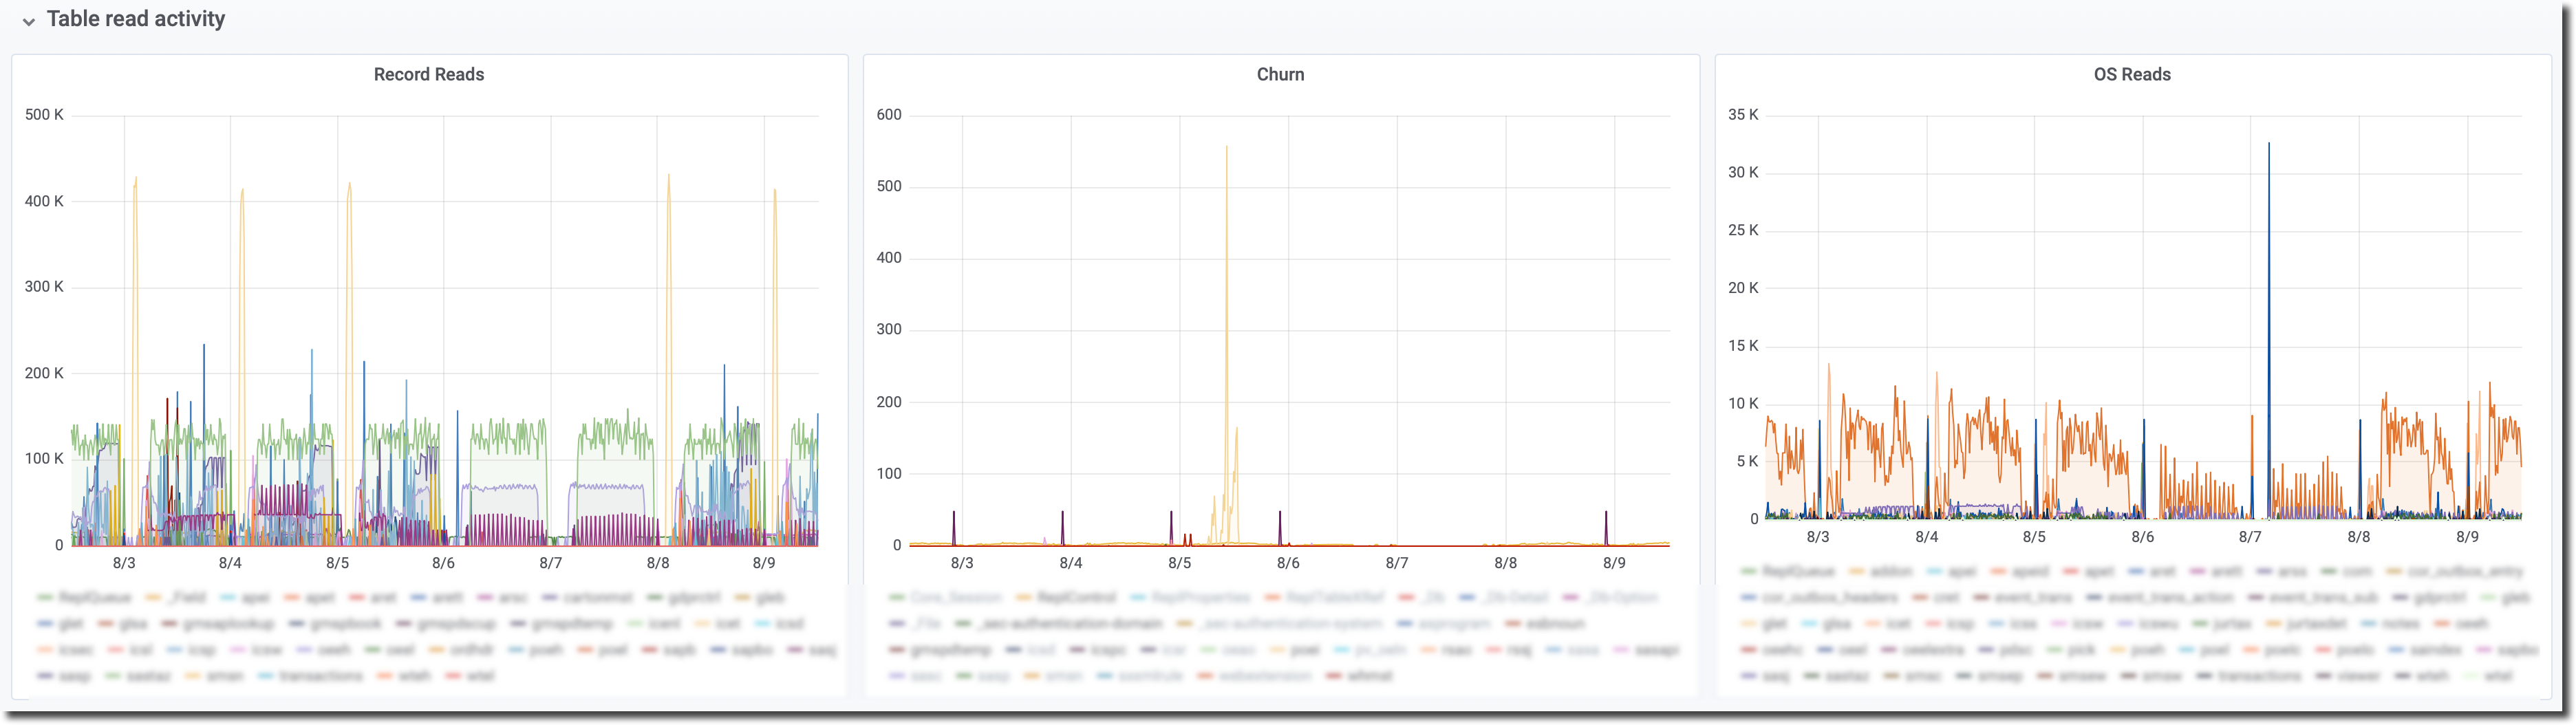
Record Reads
Pretty straightforward, this graph shows all tables with read rates above the Reads threshold. Click on a table name in the legend to see only that table. The scale will adjust according to the read rate for that table.
Churn
Churn (aka turns: deprecated) is the ratio of record reads to the number of records in that table. For instance, a table with 100 records read 1000 times per second would have a churn of 10. Churn does not necessarily mean that "table scans" are taking place – it could just be a single record read repeatedly.
BF1, BF2, BF3, and BF3 latch activity in the Latches and resources dashboard could indicate table scans versus hot blocks. These four "latches" are virtual constructs. Each buffer block has its latch, but it would be impossible to maintain statistics on BF1 to BF2,000,000! So, the buffer pool is split into four, and the statistics of the associated latches roll up into the BF1-4 counters.
Usually, BF1 thru 4 are roughly equal as users randomly access the thousands or millions of buffer blocks in memory. If one of the four counters is "hot" (much more activity than the others), then it could mean that a query is reading a tiny number of records in a small number of blocks and skewing the counters.
OS Reads
OS reads are interesting because they highlight tables that may not be part of the working set of data. Most OLTP data should be in the buffer pool as your business processes orders, builds, ships, and invoices products. High OS reads are more likely related to reporting or inefficient queries.
NOTE: OpenEdge only provides per-table OS read statistics in version 10.2B and later for tables in Type II storage areas. If your database runs on 10.2B and you do not have any data points for OS reads, you may need to update your VST schema:
proutil dbname -C updatevst
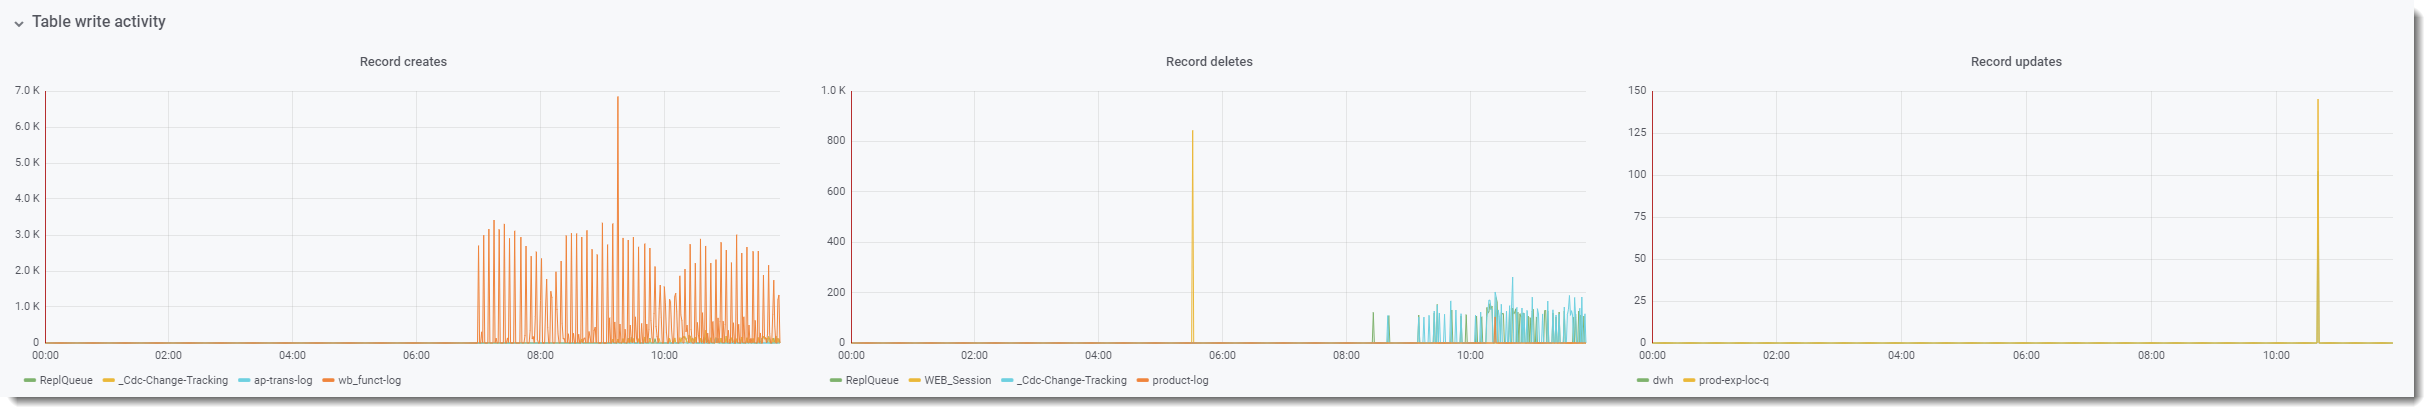
Table Write Activity
These graphs show table write activity for active tables in the database. Minimum activity thresholds are defined in resource maintenance to prevent cluttering the charts.
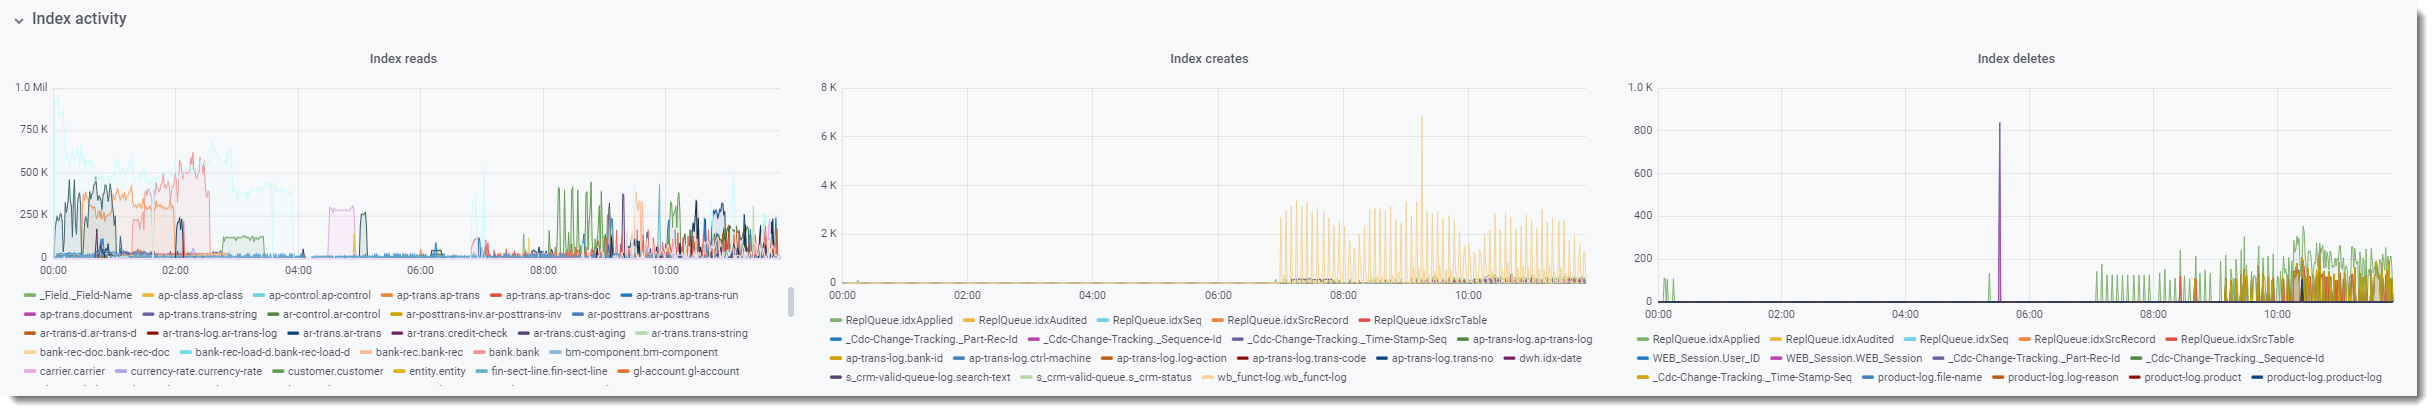
Index Activity
These graphs show index activity for active indexes in the database. Minimum activity thresholds are defined in resource maintenance to prevent cluttering the charts.
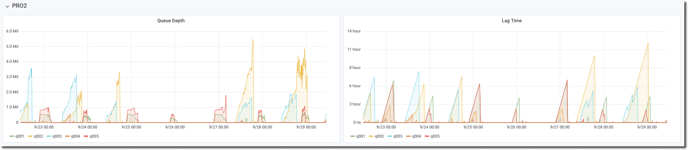
PRO2 Activity
These graphs show PRO2 replication Queue Depth and Lag Time.
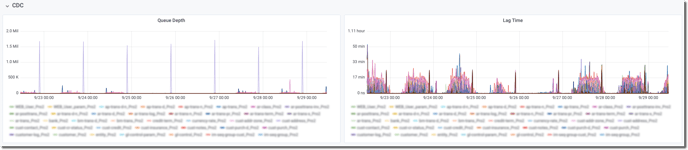
CDC Activity
These graphs show Change Data Capture Queue Depth and Lag Time.