User Information Viewer (U)
User Information Viewer (U)

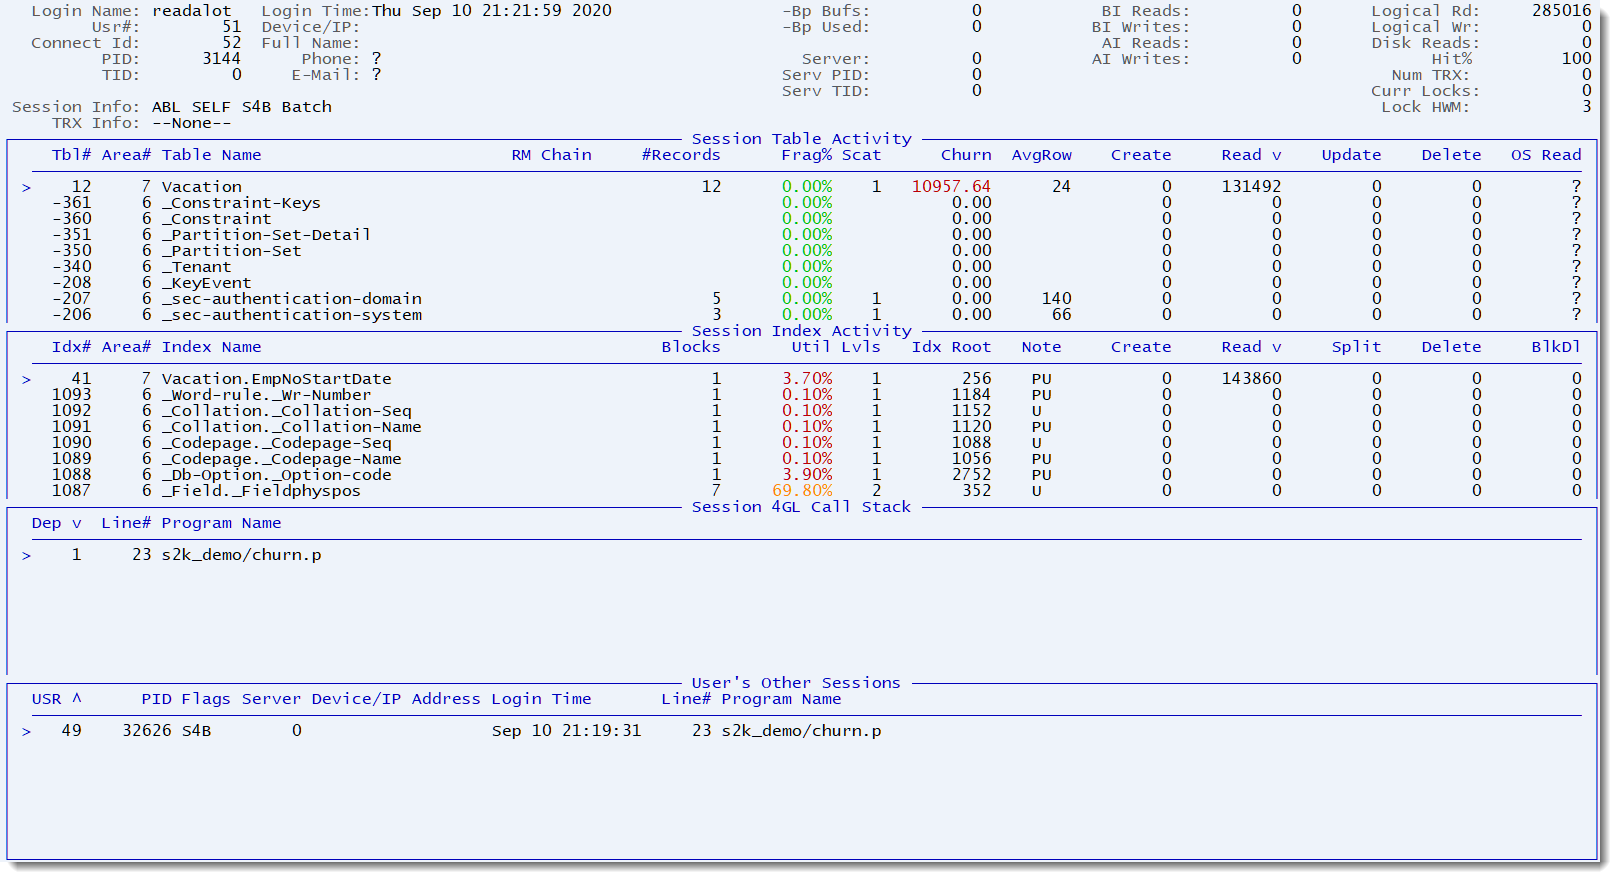
The User Information Viewer drills down and focuses on one particular database connection. Select the user by user number (Set Usr# (#)) or PID (Set Process ID (P)).
Field Descriptions
| ProTop RT Label | Alertable Metric* | Description |
| Login Name | N/A | Login name of the user being viewed |
| Usr # | usrNum | User number of the user being viewed |
| Connection Id | N/A | Connection ID of the user being viewed |
| PID | usrPID | OS process ID |
| TID | N/A | Process thread ID. In OpenEdge v11 and v12, the only client processes that are multi-threaded are PASOE agents. |
| Session Info | N/A | See below |
| TRX Info | N/A | Transaction information |
Session Info values
| Flag | Description |
| Type | ABL or SQL |
| Cnx | Self service or remote client server |
| S | Shared memory client |
| R | Remote client |
| L | Login broker |
| @ | Server |
| H | helper |
| O | Other |
| 4 | 4GL Client |
| W | Webspeed client |
| B | Batch client |
| A | Application server |
| P | PASOE |
| Q | SQL |
| X | Unknown |
| * | Transaction active |
| d | Disconnecting |
| r | Undo or error |
| I | STOP or Ctrl-c |
| N- | Notification pending |
| -N | Notification in process |
| NN | Notification pending and in process |
| ProTop RT Label | Alertable Metric* | Description |
| Login Time | usrLoginTm | Date and time the User connected to the database server |
| Device/IP | usrIPAddr | If connected via shared memory, the device (tty) associated with the process. If connected via Remote Client, the IP address. |
| Full Name | N/A | Full name of the user, if available |
| Phone | N/A | Phone number of the user, if available |
| N/A | E-Mail address of the user, if available |
| ProTop RT Label | Alertable Metric* | Description |
| -Bp Bufs | N/A | The maximum number of private read-only buffers set at client startup |
| -Bp Used | N/A | The current number of private read-only buffers |
| Server | usrSrv | For client/server connections, the user's server connection ID |
| Serv PID | N/A | Server OS process ID |
| Serv TID | N/A | Server Thread ID. As of OpenEdge 12, server processes are multi-threaded |
| ProTop RT Label | Alertable Metric* | Description |
| BI Reads | N/A | Number of BI Reads by the usercmd |
| BI Writes | N/A | Number of BI Writes by the user |
| AI Reads | N/A | Number of AI Reads by the user |
| AI Writes | N/A | Number of AI Writes by the user |
| ProTop RT Label | Alertable Metric* | Description |
| Logical Rd | N/A | Number of logical read by the user |
| Logical Wr | N/A | Number of logical written by the user |
| Disk Reads | tblOSRd | Number of operating system reads by the user |
| Hit % | N/A | Percentage of logical reads from the database buffer cache |
| Num Trx | N/A | Number of committed transactions by the user |
| Curr Locks | N/A | Number of records currently locked by the user |
| Lock HWM | N/A | High water mark of concurrent locks |
Session Table Activity
This section displays detailed information on the tables being accessed by the user.
Session Index Activity
This section displays detailed information on the indexes being accessed by the user.
Session 4GL Call Stack
If client statement cache is enabled, information on the program and line of code being executed will appear here. Note that this is the last line of code to access this database, not necessarily the last line of code executed by the client.
User's Other Sessions
It can be useful to know if the same user is logged in multiple times, and to see information on those other logins.