Click on whitespace in a resource line, and the Alerts window to the right will be filtered to show only alerts for the resource line you clicked on.
Click directly on a given resource name to be redirected to the Trends Dashboard for that resource.
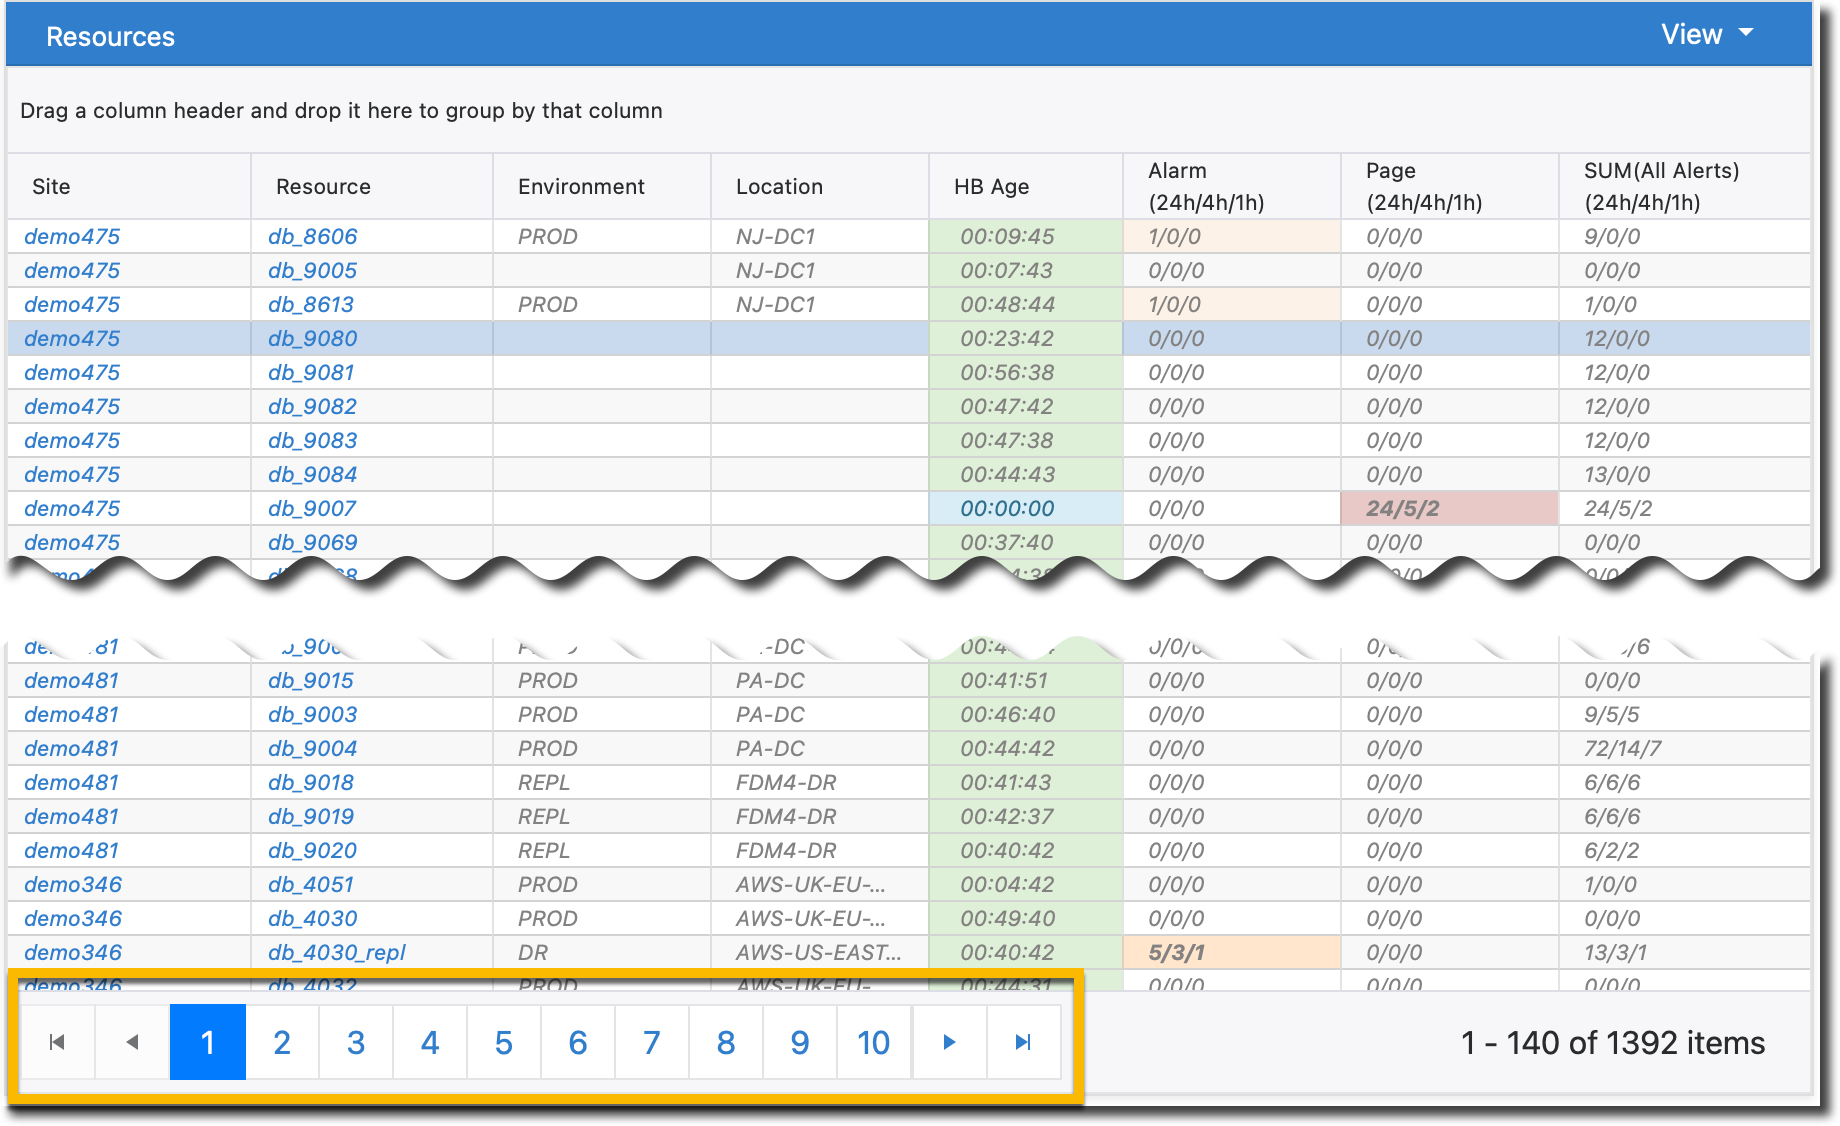
The list can be filtered using the Omnisearch Bar to reveal particular resources of interest.
The list can be further grouped and sorted for browsing if you administer many resources. And the Sites are paginated at the bottom of the window (in yellow):
To GROUP resources, click and drag the column header for Site, Environment, or Location to the grouping line just above the header.
Here we have grouped by Site and expanded resources for "abc":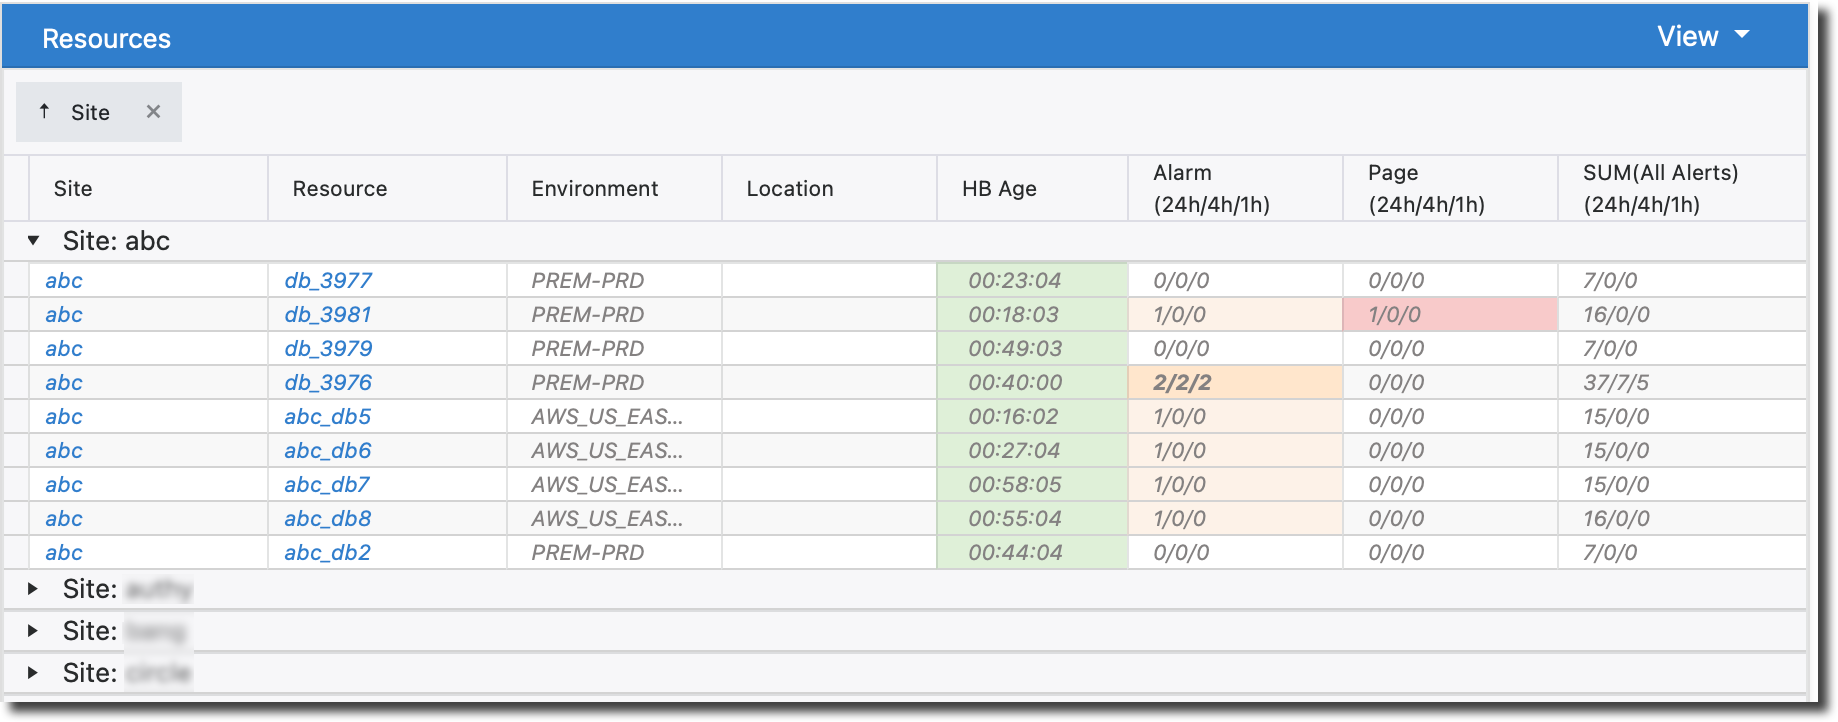
To remove this grouping, click the x in the header box you dragged up to the grouping line.
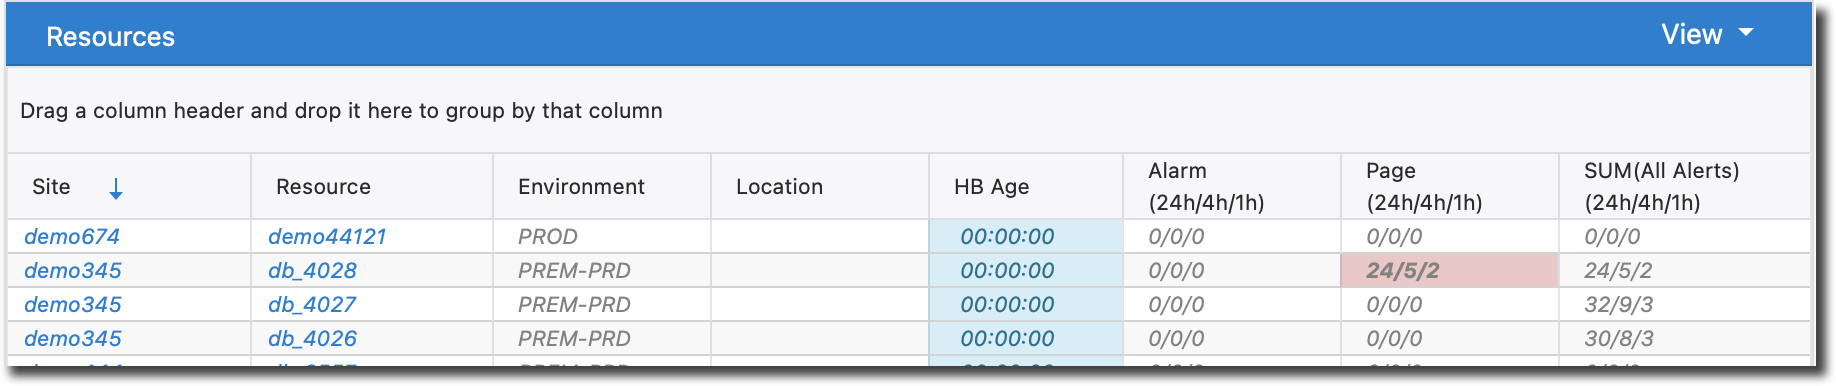
To SORT simply click on the header you are interested in sorting by. Successive clicks on the header cycle through sorting alphabetically ascending, descending, and default sort order. Here is the Site list in descending order:
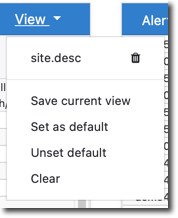
Grouping and Sorting change the VIEW of the Resources window. You can save a preferred view by clicking the "View" dropdown in the upper right corner of the Resources window. Click Save current view to name and save your view to the top of the view dropdown menu. You can also choose to un/set the default view you see whenever you arrive on the dashboard page. To delete a view, click the trash barrel to the right of the view name you saved earlier.
Each resource line contains a sub-menu. Right-click on whitespace in the resource line of interest and the sub-menu will be revealed:
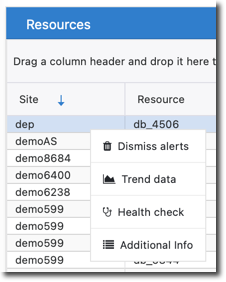
- Dismiss Alerts - [ disabled ]
- Trend Data - same as clicking directly on a resource name, takes you to the Trends Dashboard for that resource
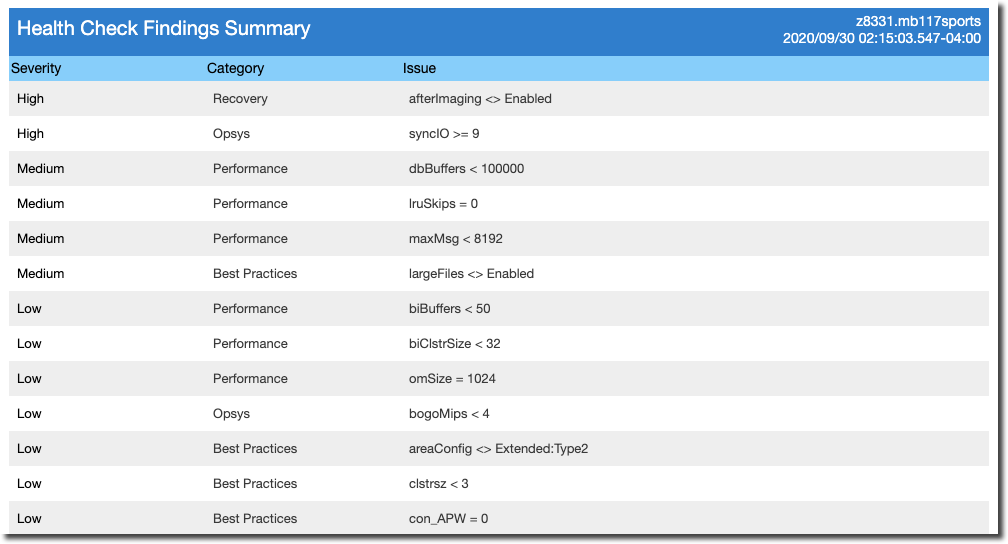
- Health check - if the resource is a database and a health check has been run for it this will display the contents of the most recent health check:
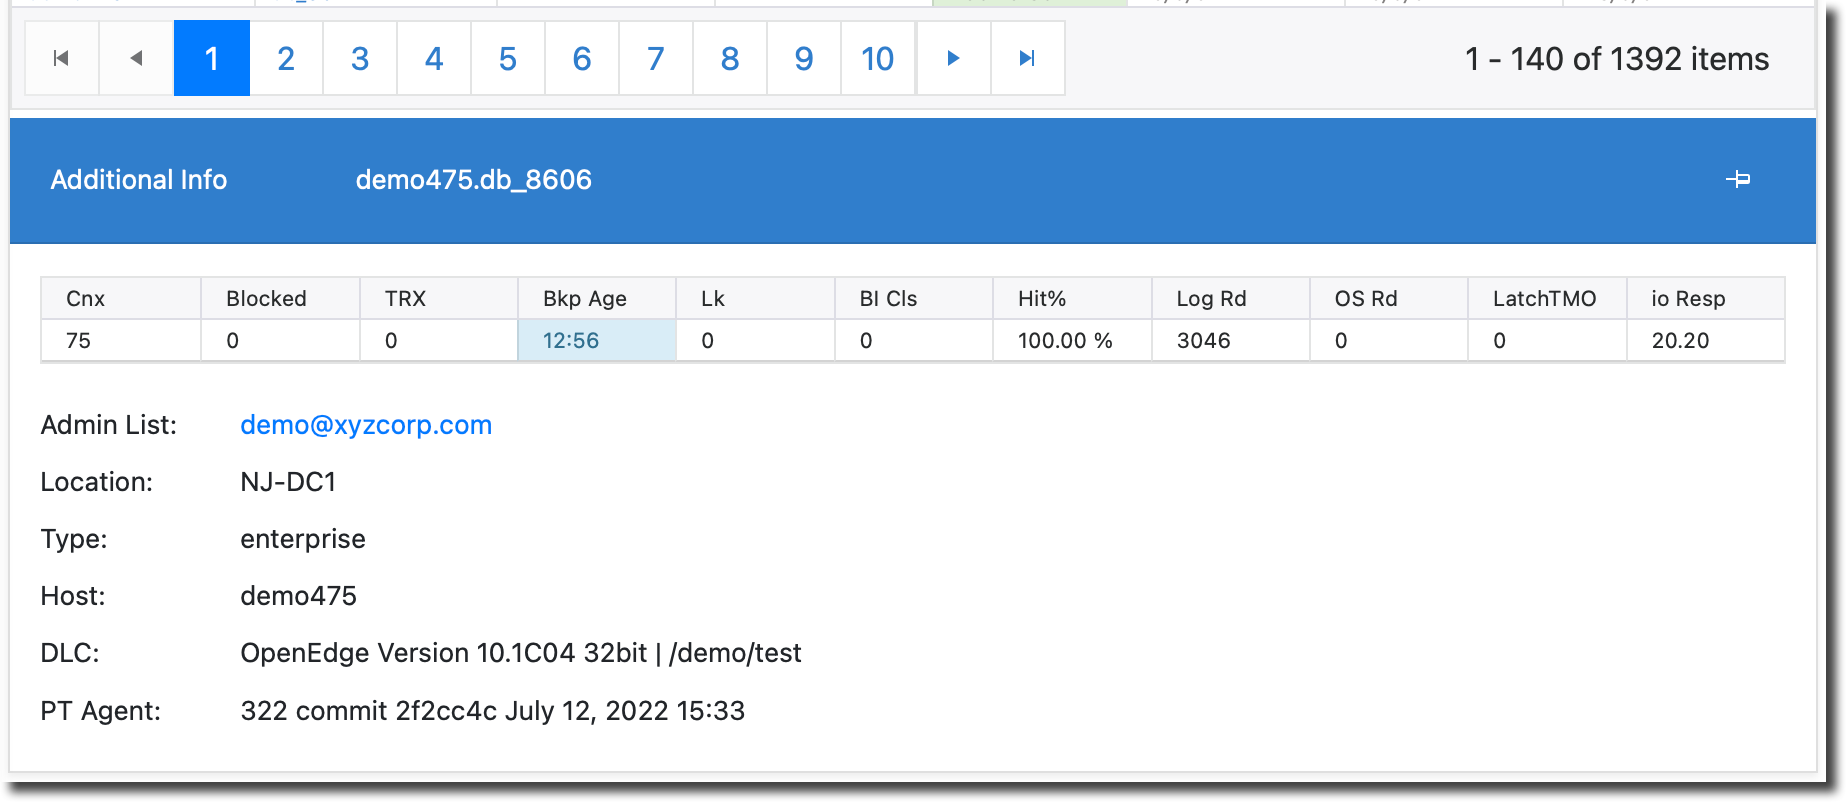
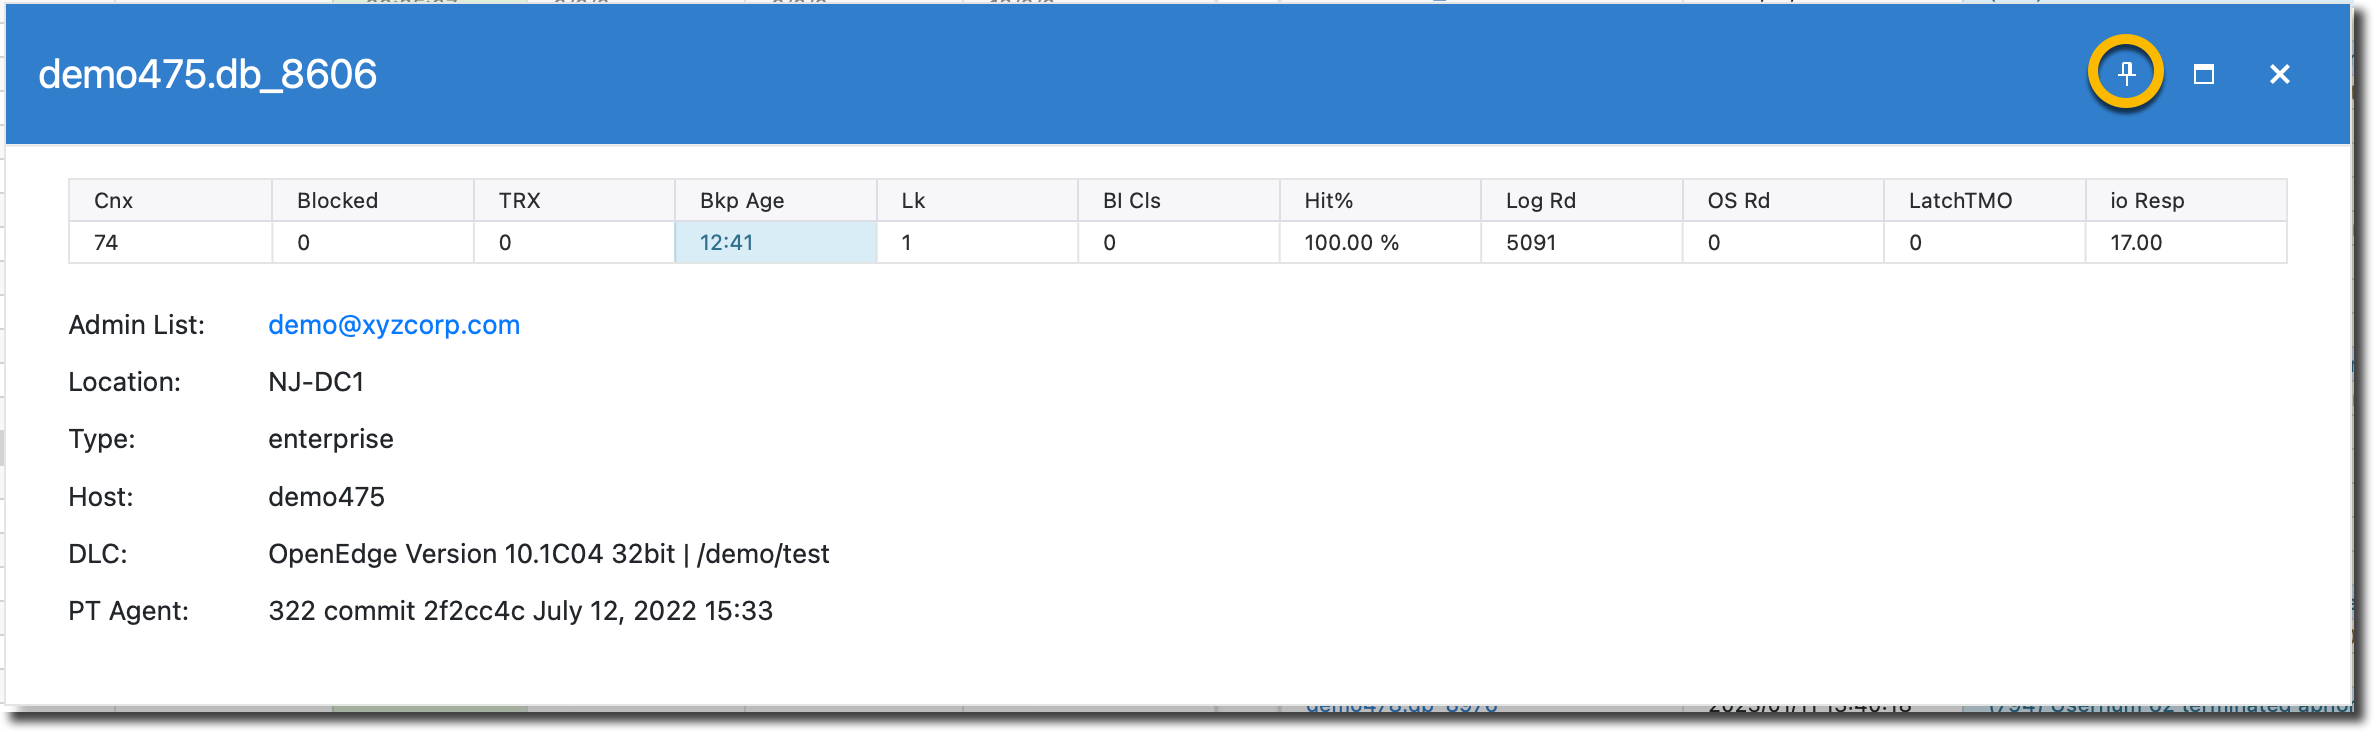
- Additional Info - Presents a pop-up that reveals the following critical data for that resource (note the pin circled in yellow *):
|
Column |
Information |
| Cnx | Number of connections to the Resource |
| Blocked | Number of users blocked from the Resource |
| TRX | Rate of transactions per second (commit rate) |
| Bkp Age | Elapsed time since the last backup (dd hh:mm) |
| Lk | Number of Resources locked |
| BI Cls | Number of BI clusters in use |
| Hit% | Buffer hit ratio. Percentage of Database Resource requests read from memory |
| Log Rd | Logical reads per second |
| OS Rd | OS reads per second |
| LatchTMO | Number of latch timeouts |
| io Resp | I/O response time |
* Click the icon to "pin" this pop-up below the pagination. You will now see this data for each resource line you click without going through the sub-menu. Click the pin icon again to hide Additional Info: