These days, anyone should be able to adjust their terminal or terminal emulator to 160 by 48 or greater, by adjusting the screen geometry and font style/size. If you are one of the few who can't do that, you can now use ProTop RT for the first time. It can now run in a console with fewer than 160 columns and 48 rows; we are calling this mode "ProTop Core". Obviously, it won't show as much information as the full UI but you will see the essentials:
Small yet insightful
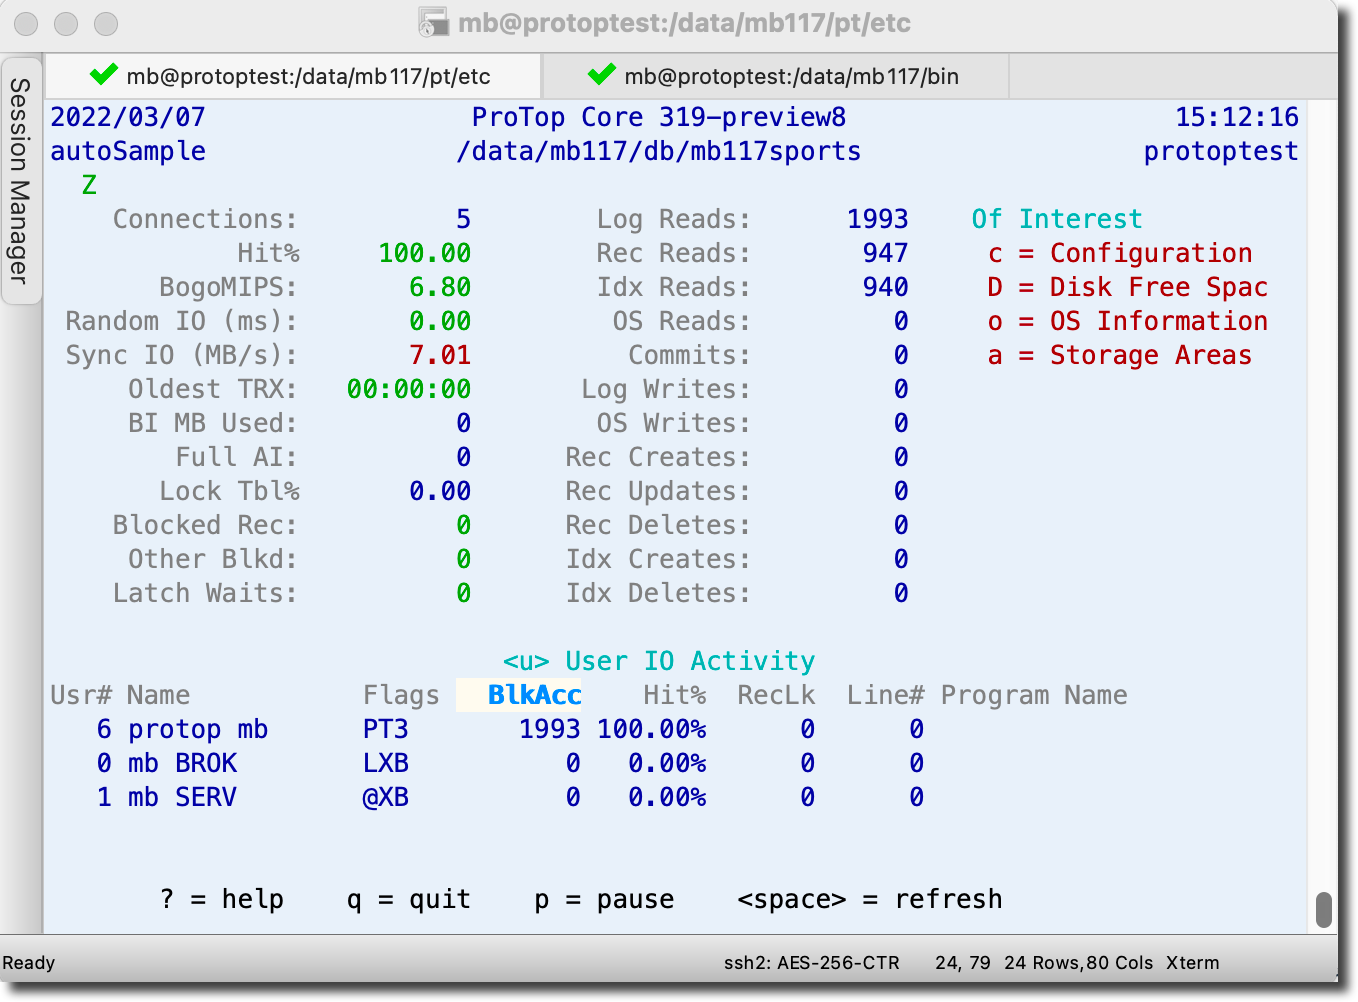
Even in a window as small as this, ProTop calls your attention to items of interest. Notice the number 7.01 in red on the left for instance. ProTop thinks it is taking too long to make unbuffered writes to your database disk subsystem. The disks may simply be slow, or you might be competing unexpectedly with other users for IO throughput. In any event, it is worth looking into.
ProTop Core introduces the "Of Interest" frame in the top right corner of the screen. This displays a list of any panels, with their associated command keys, that currently contain a metric with "alert" highlighting based on its current value. This frame can be toggled with the '\' key and it is available in the main UI mode as well.
Notice "c = Configuration" is listed in the Of Interest panel in the above image. Type "c" to reveal the alert and alarm type items on the Configuration dashboard:
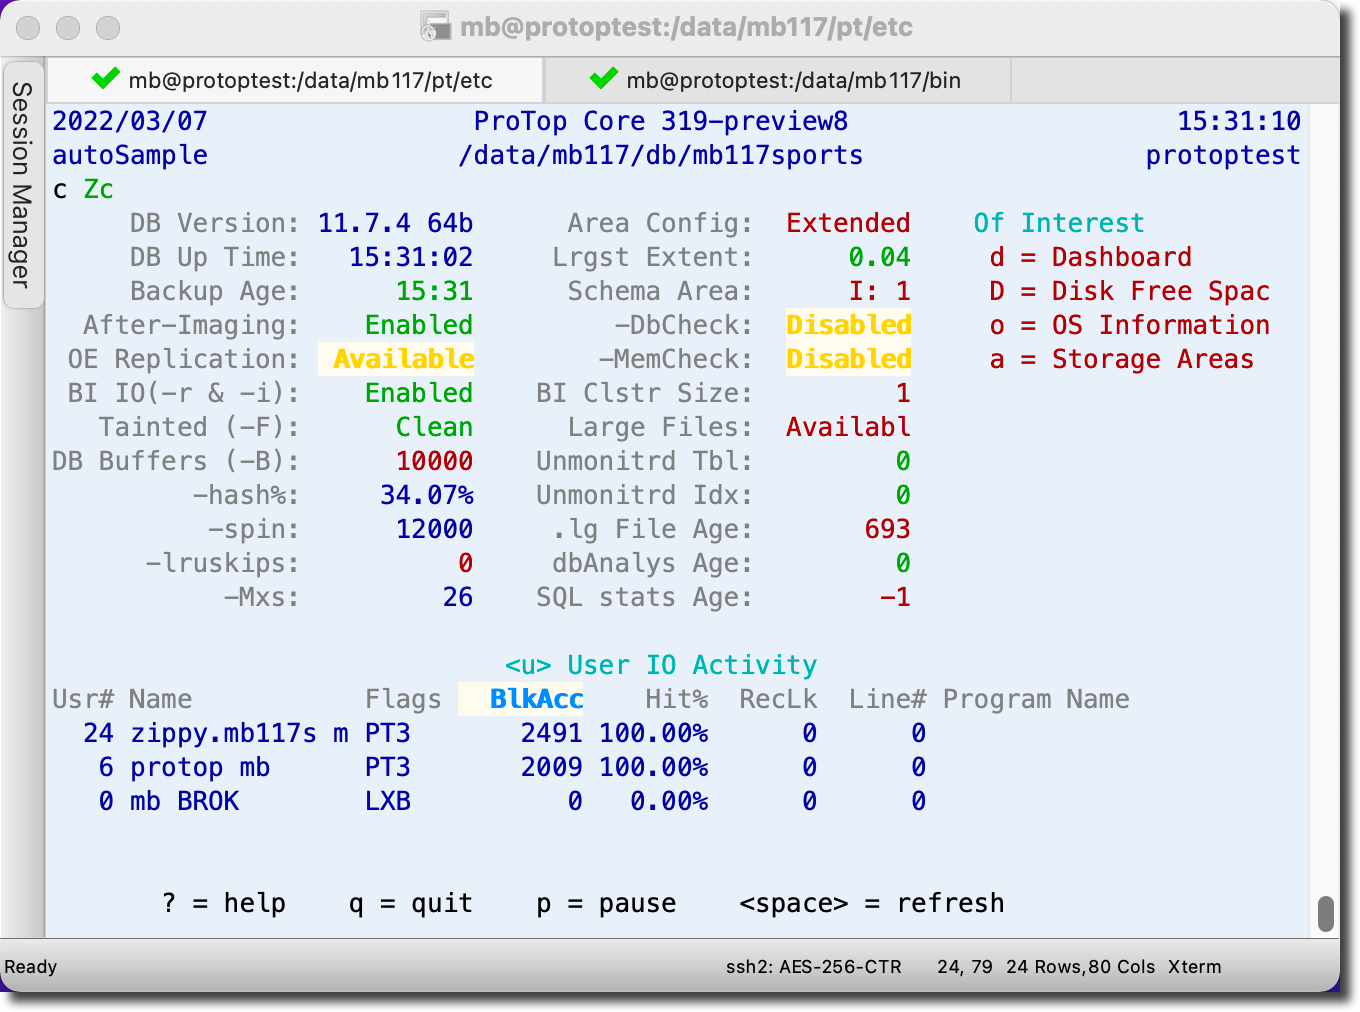
In this dashboard, we see that while the OE Replication product exists for this version of Progress, it is not enabled. The 10000 in red is telling us we likely have too low an amount of database blocks in memory for a normal database application. In this case -B is set to the default and likely should be changed to accommodate the needs of a "real" application. This screen also tells us -lruskips is not set, large files are not enabled, and the database log file is not likely being managed as it is 693 days old, etc.
Navigation
Like its big brother, ProTop Core is used by typing command keys to see different dashboards at the top section of the screen, or panels below the dashboards. The taller you make the screen the more panels you can see at once. ProTop Core will tell you when it is running out of real estate.
To hide a dashboard or panel simply type the same command key. If you don't recall the key you pressed for a particular panel, there is a reminder in the panel header between < and >. In this case, typing "u" as found in "<u> User IO Activity" in the image above will hide this panel to make room for another.
To see all of the command key options, type "?" to bring up the help screen:
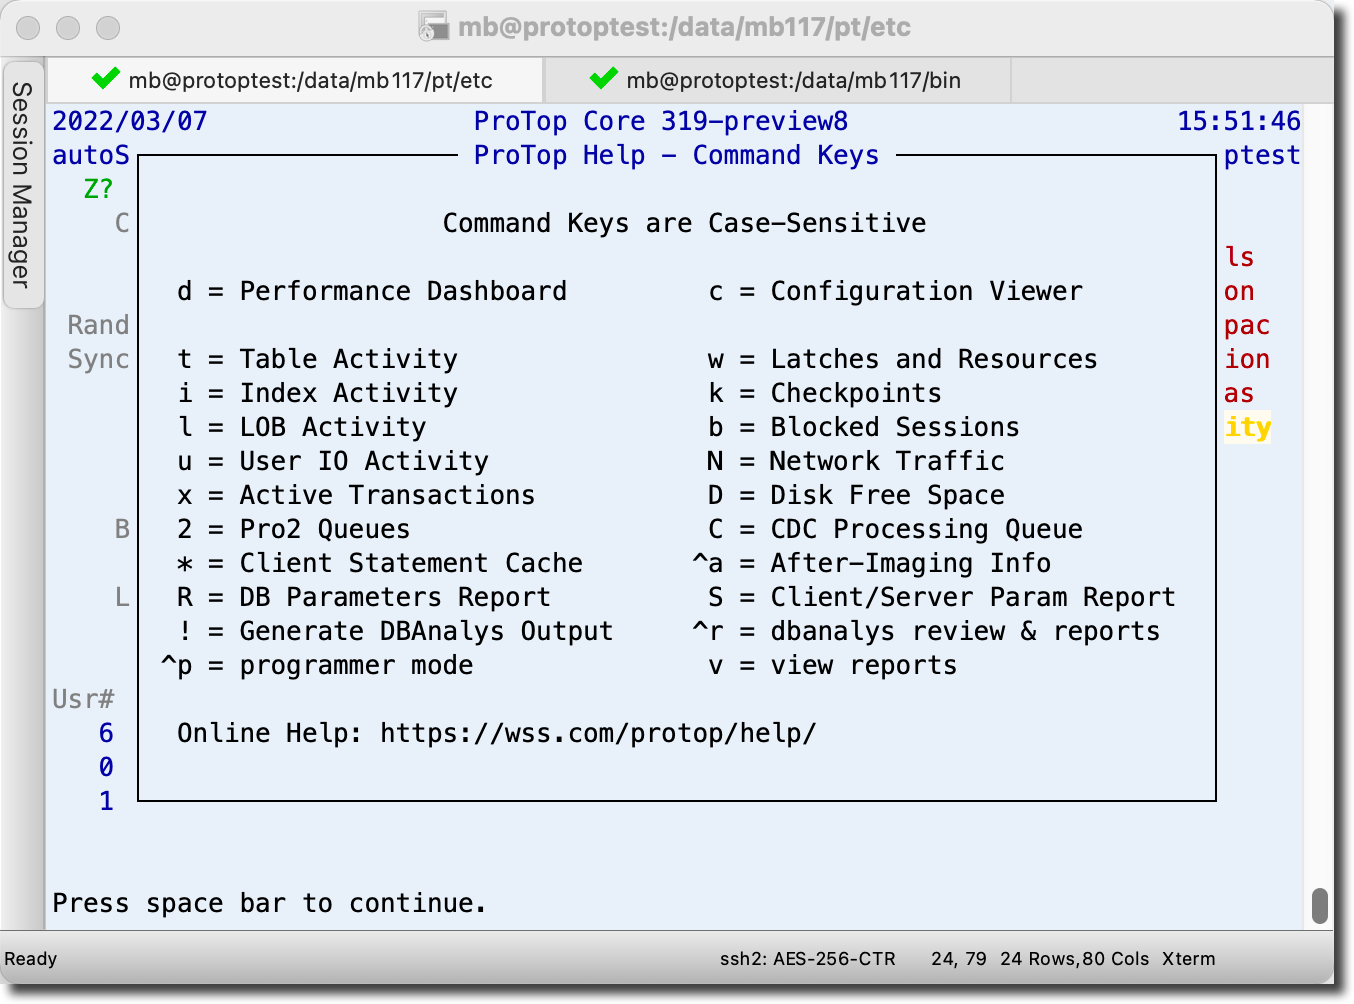
Press the space bar to hide the help screen.
Want more help?
All of the dashboards and panels in Core are subsets of ProTop RT. You will find details on the elements of each screen in ProTop Help.
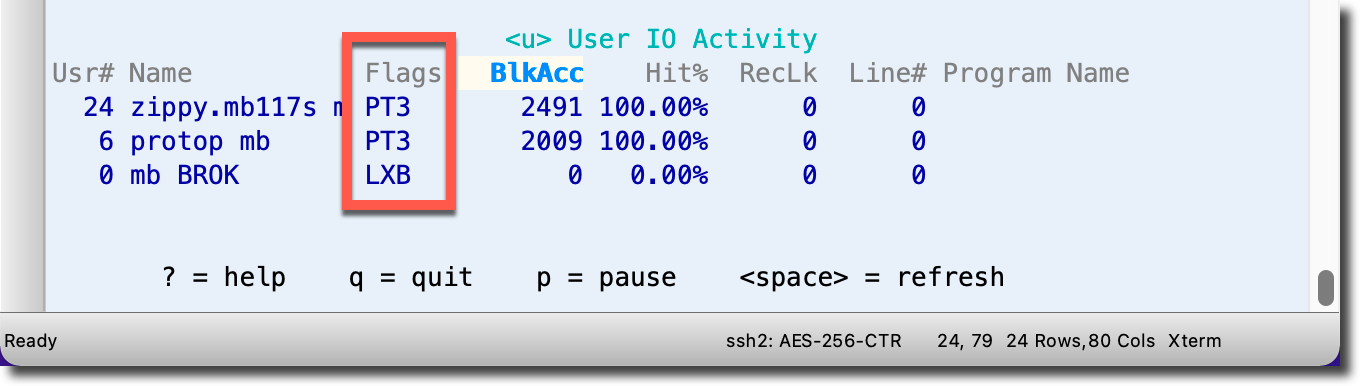
For instance, navigate to the User IO Activity (u) page in ProTop Help to see more information about the Flags column:
Questions?
Please reach out to us using the links on this page and we will try to respond within one business day.