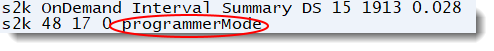
In programmer mode, the sampling interval is changed from automatic to on demand and the displayed data is displayed in raw numbers rather than converted to a rate. This allows the programmer to run a program, refresh the screen, then see exactly how mnay table and index reads they did.
Non-Programmer Mode
The following displays in the upper left corner of the screen
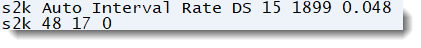
In normal, non-programmer mode, ProTop automatically samples every 'x' seconds (default is 10). The results display rates per second: reads/sec, writes/sec, etc.
Programmer Mode
The following displays in the upper left corner of the screen
Insight into Programmer Mode
The goal of programmer mode is to zoom in on your test user to see how much database activity is generated by your program. Follow these steps:
- Find the database user number or PID of the test user
- Use set Usr# (#) or set process id (P) to tell ProTop to focus on that user
- Switch views to the User Information View (U)
- Run your program
- Hit spacebar in ProTop RT to refresh the screen
The data displayed will not be rated per second, but will be the raw, total numbers for the interval between the most recent spacebar hits (refresh action). This way, the programmer knows that when he runs his code, it does 3 gajillion reads of the order table, using the order.ipart index, etc.
FAQ about oddball stuff explains the fields (interval, mode, etc.) displayed in the upper left corner of the screen.