One ProTop agent (pt3gent) at a client site can be configured to monitor many system components, in other words, these components share the same monitoring agent.
For example, an application server requires or can involve several OE components. One ProTop agent, named let's say myappsrv in etc/dblist.cfg, can be configured to monitor all of those related services (see AppServer Monitoring for details.) Once configured, myappsrv automatically appears as a single resource under your site on the ProTop portal.
Currently, the monitoring data for all of the OE components supporting myappsrv are grouped together and sent to the portal by the shared agent and appear under the same resource, myappsrv (seen here highlighted in blue):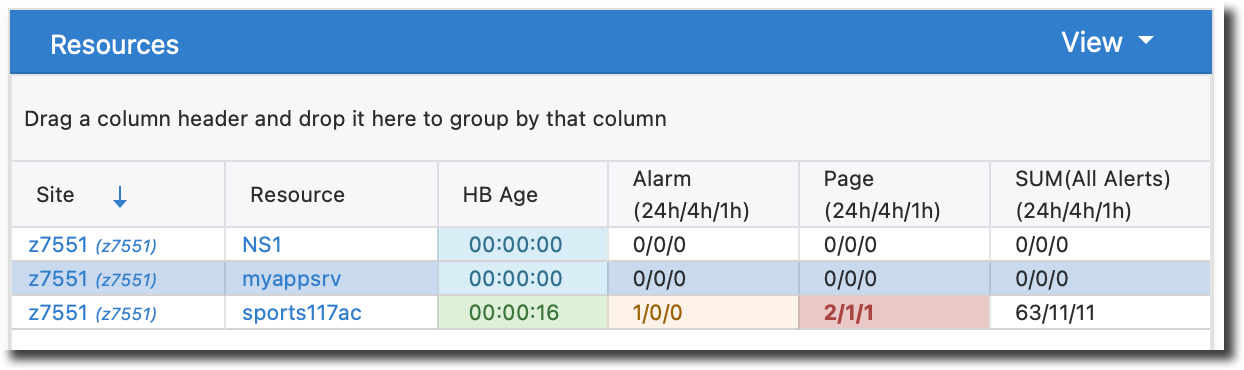
Our objective here is to make visible, in the portal the details of each of the components monitored by the shared agent, as well as to be able to filter alerts related to those components.
To this end, we will create the first resource listed in the image above, NS1, which is actually monitored by myappsrv.
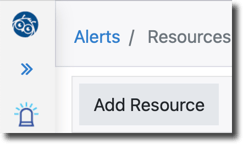
1. Click the Resources icon in the left side menu (visible only to users assigned the admin or super admin role):

2. Click the Add Resource button in the top left:
You will see the Add Resource pop-up:
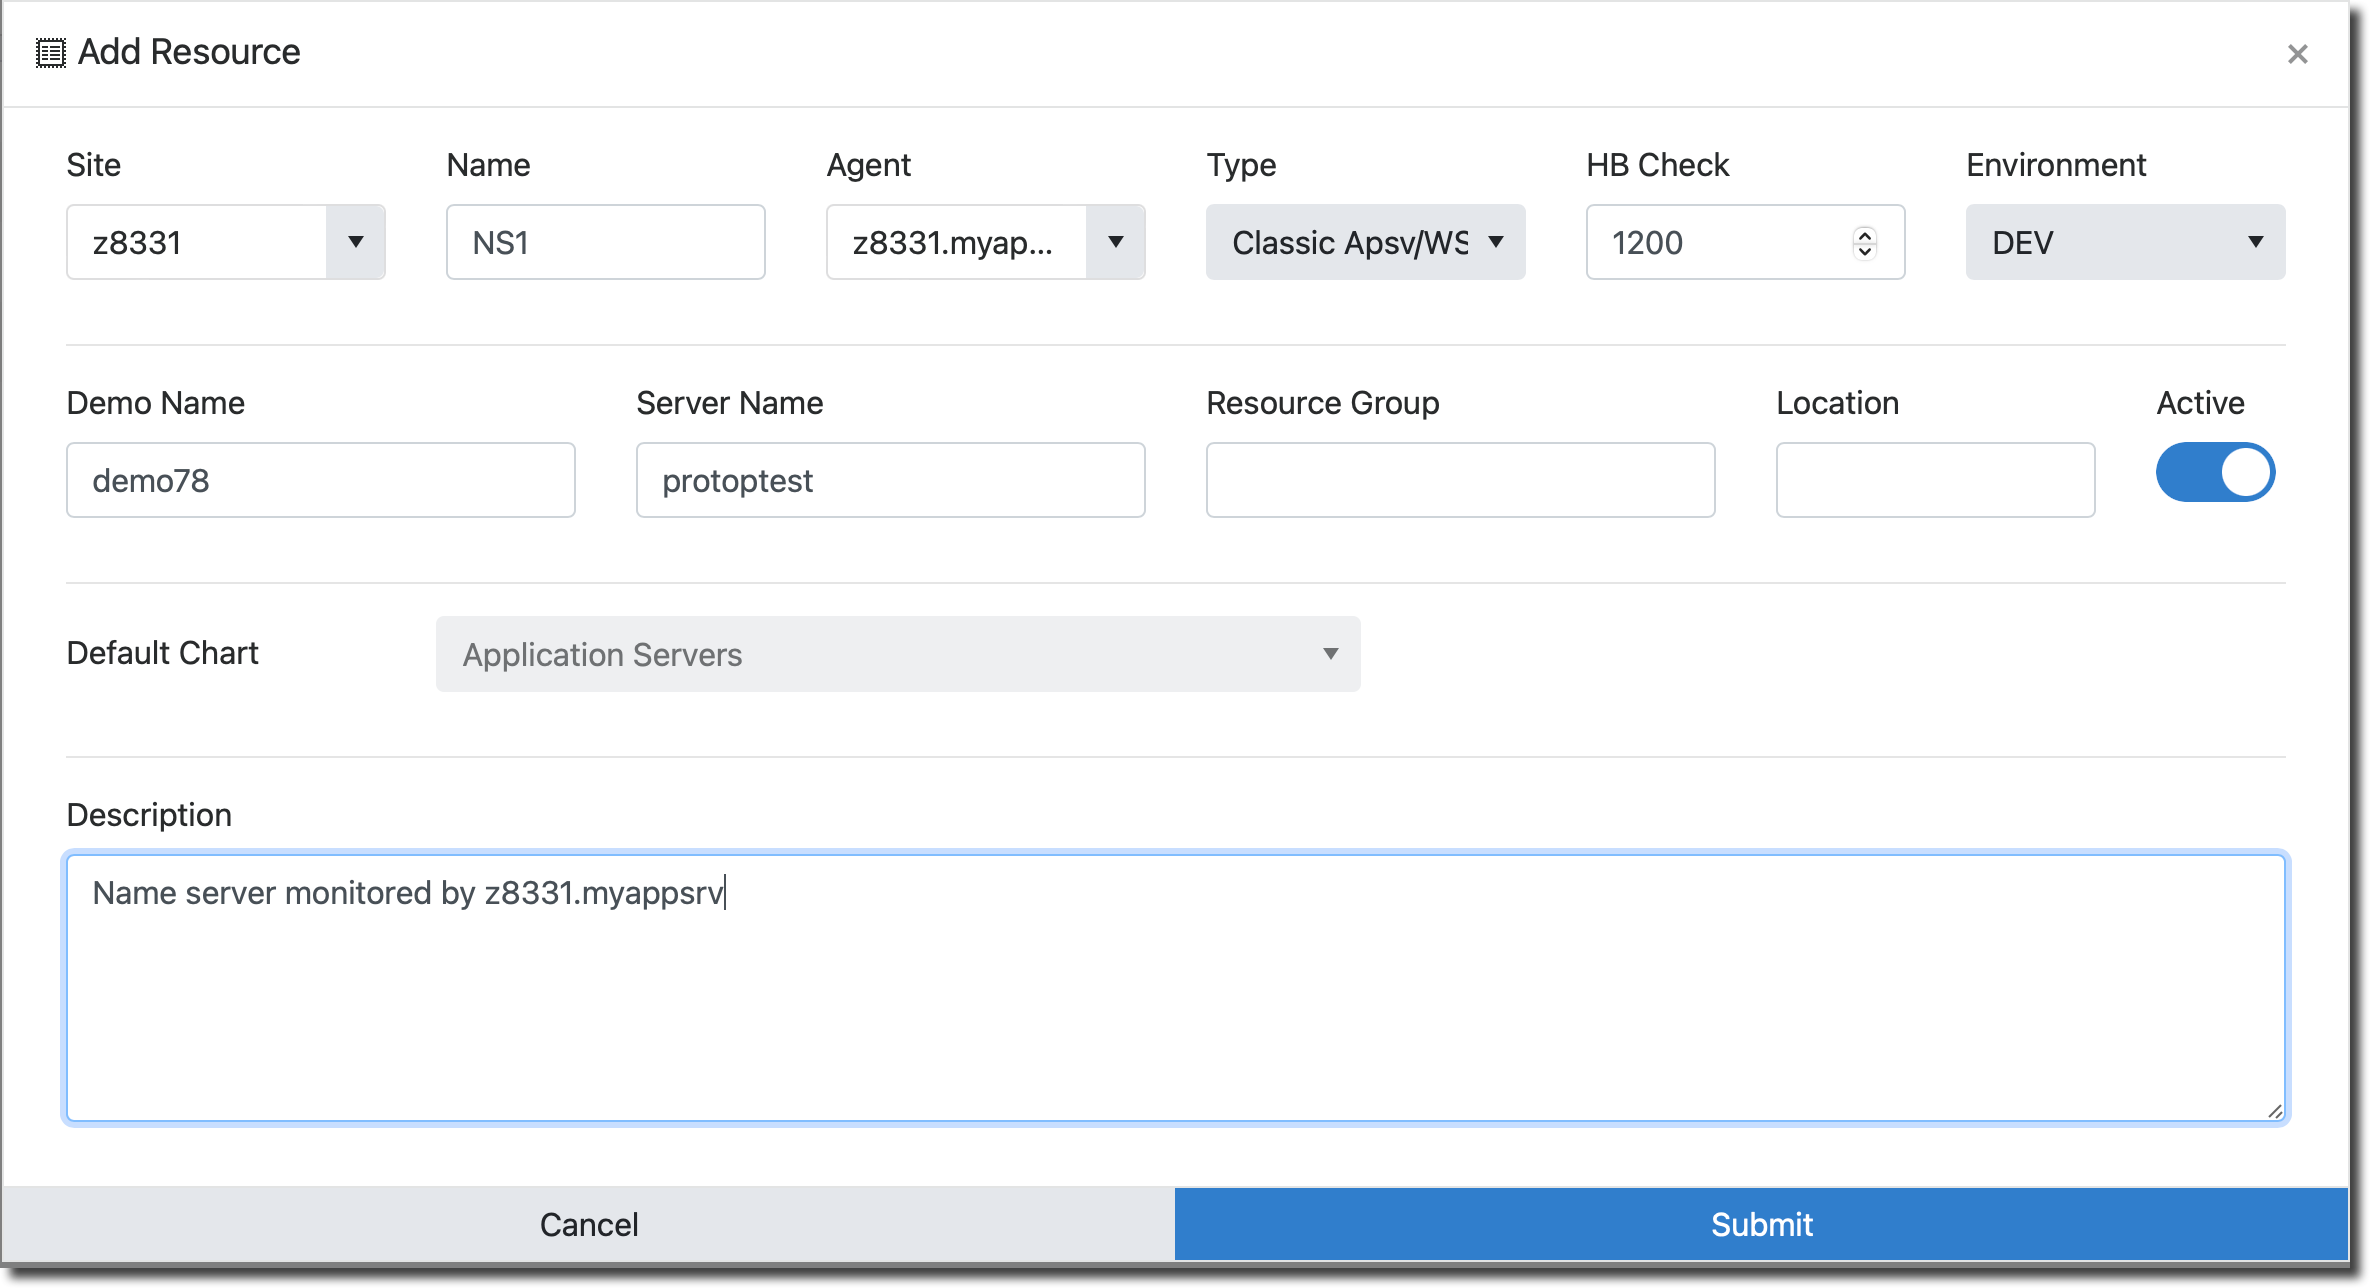
3. Select your site.
4. Give this new resource a name, in this case, NS1.
5. Select the name of the agent we know is monitoring the NS1 component, z7551.myappsrv.
6. Type is Classic Apsrv/WS.
7. Enter the server name NS1 is running on.
8. Notice the default chart, also known as Dashboard, is set to "Application servers."
9. Give this resource a description, in this case, the name server is being monitored by the "myappsrv" agent.
10. Click Submit.
The new resource is created and appears in the Resources Administration list: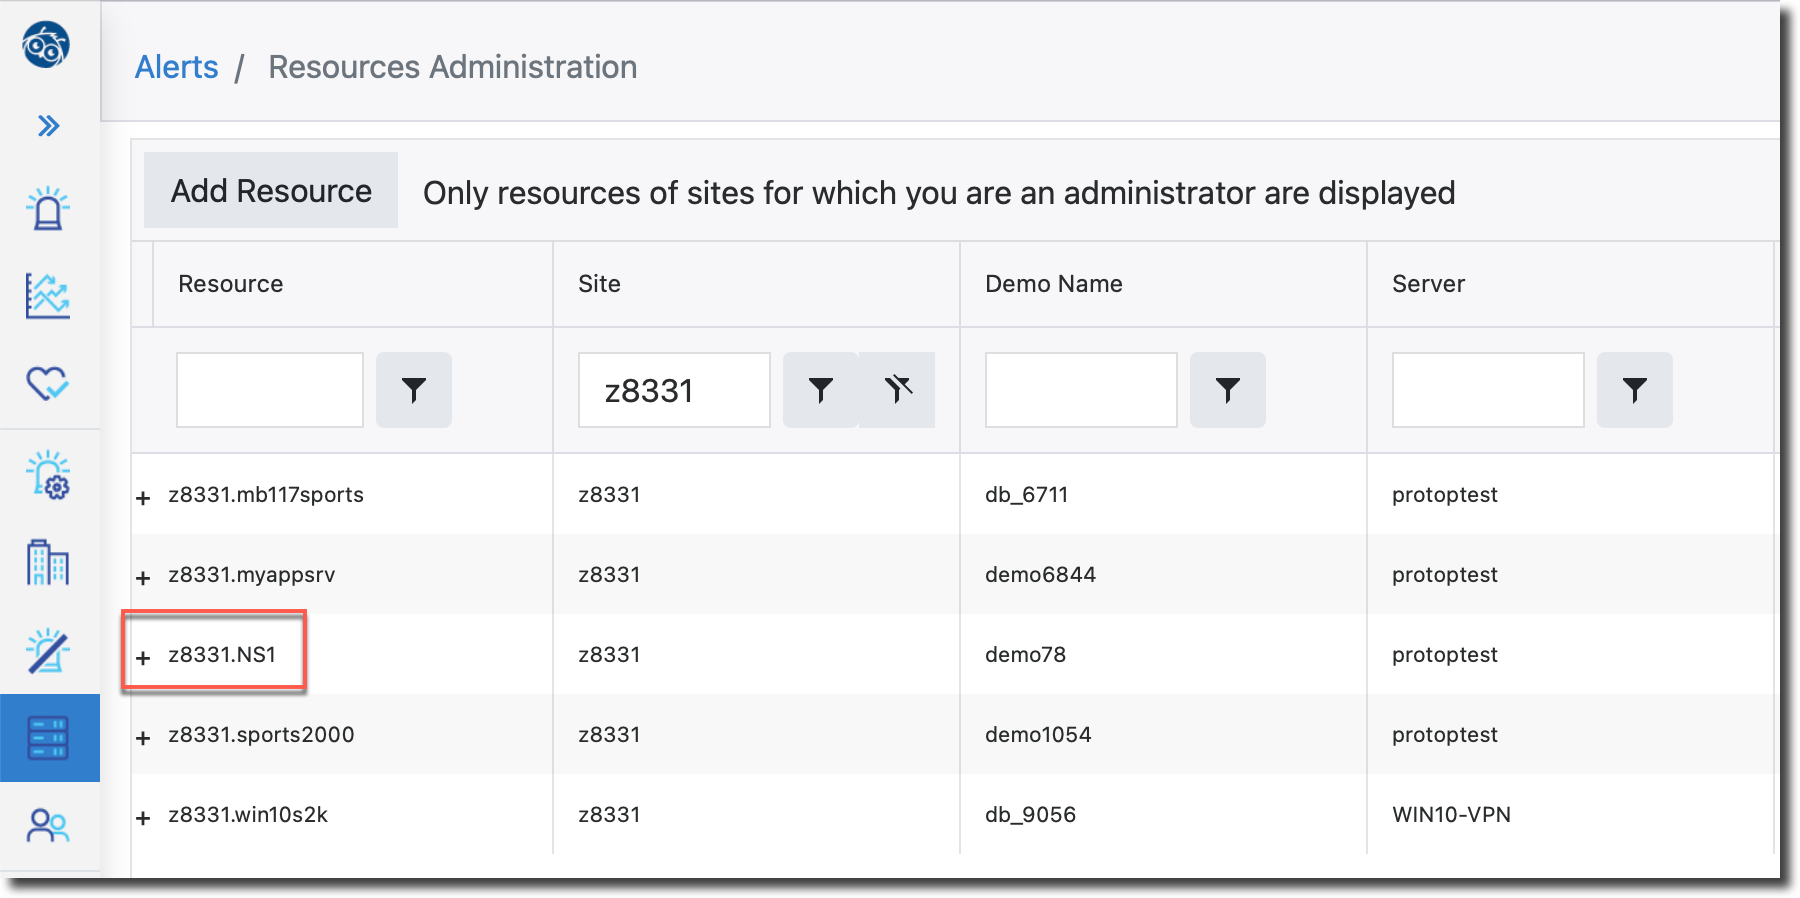
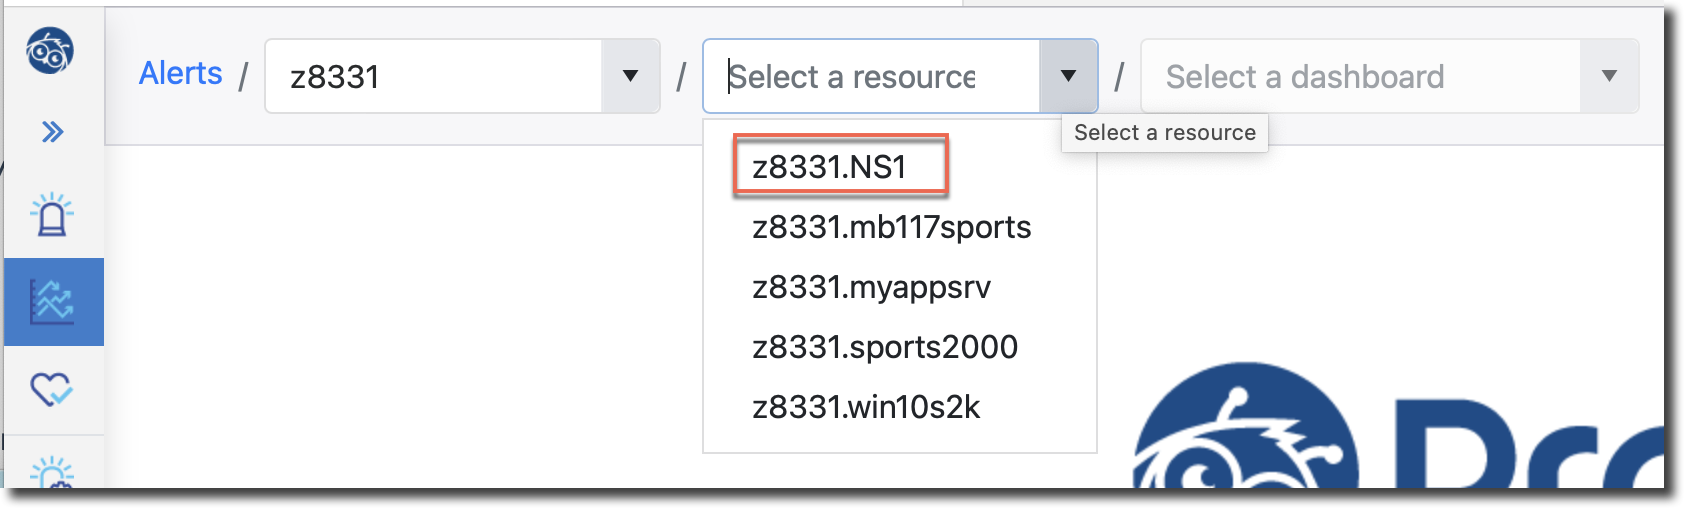
The new resource also appears in the Resources window in the Alerts Dashboard: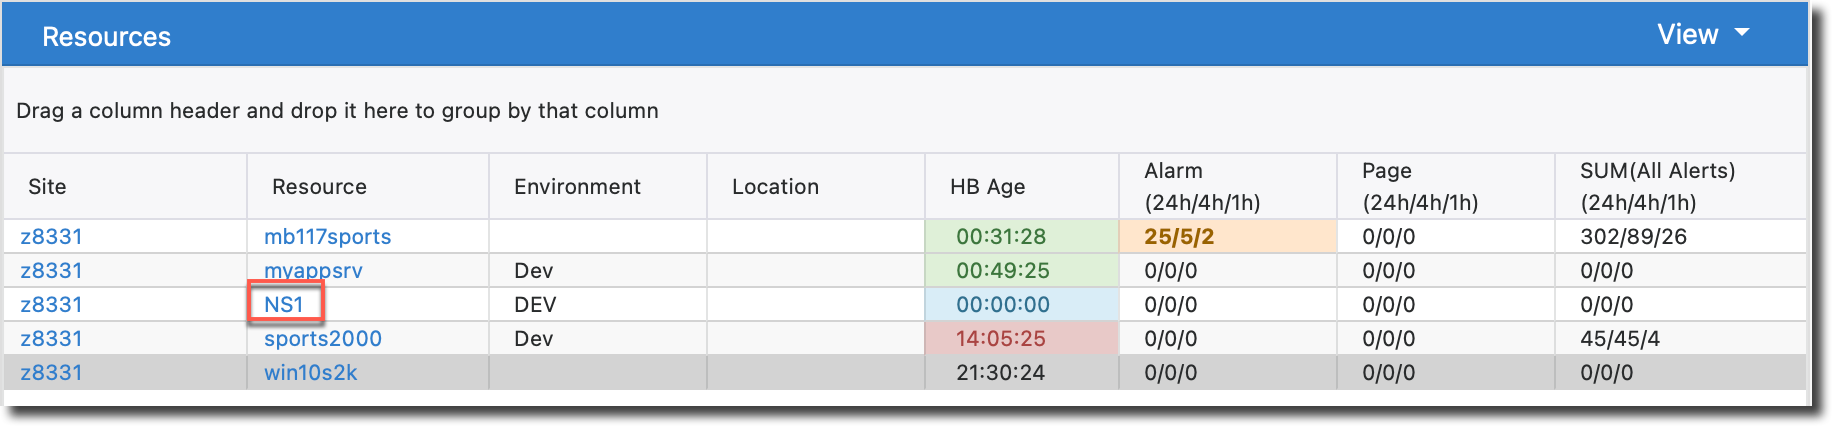
And it appears in the Trend Data resource dropdown for this site:
You can now repeat this process for the other OE components listed in your etc/appsrv.myappsrv.cfg file.
Conclusion
You will now be able to see the details of your newly defined resources like any other, and if you define alerts based on the AppServerStatus Data Collector you can filter alerts for your new resource names. This is especially handy if you have multiple app servers defined at your site.