Alert Text
otrx Old Transaction 3652 > 3600
otrx otrx 349 > 300 [depricated]
duration duration 653 > 600 [depricated)
Description
ProTop is configured to alert you to the presence of old transactions by default. The alerts show up in the Alerts feed in the ProTop portal. If client statement cache (CSC) is enabled (see below) for the session holding the old transaction, and the alert definition includes the zOldTRXDetails enhancer, you may well see the line number and the name of the procedure the session is currently running at the bottom of the alert details in the portal: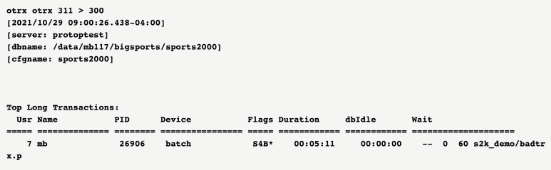
Old transaction alerts are configured in your alert.*.cfg by default (from the latest etc/alert.cfg):
otrx   num  >       7200  "" "hourly" "Old Transaction &1 &2 &3" zOldTRXDetails,alarm
otrx   num  >       3600  "" "hourly" "Old Transaction &1 &2 &3" zOldTRXDetails,alert
See Alert Configuration for more information.
You can create Alert Responses (e.g. send an email to a distribution list) to inform you of the arrival of alerts on the portal.
Corrective Action
NOTE: To find PASOE code, see this Progress KBase article.
OPTION 1: Use ProTop real-Time (RT) to find the code causing long-running transactions.
- Start ProTop RT against the database experiencing the old transaction as reported in the alert.
- You will see the age of the oldest transaction in this database, in the upper right of the performance dashboard, command key "d":
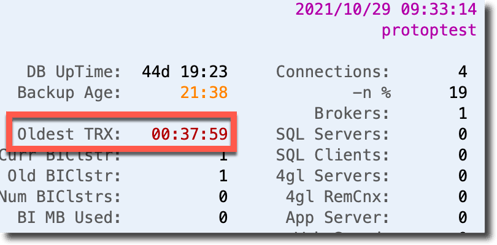
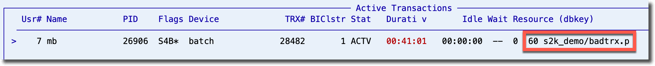
- Type "x" to see the Active Transactions detail panel:

- We have only one open transaction so this is simple. The oldest transaction will be at the top of this panel by default. Make note of the Usr#, 7 in this case.
NOTE: To find PASOE code, see this Progress KBase article. - Type "#" to open the DB Connection Number panel:
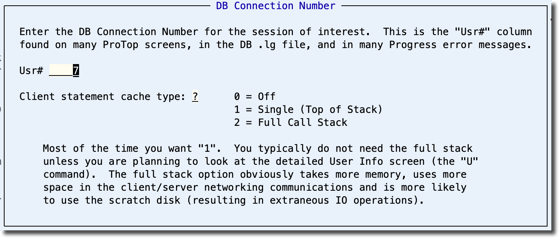
- Type the Usr# of interest noted above, hit enter, and type "1" to get the top of the procedure call stack and press return.
- At the next screen refresh you may well see the line number and procedure name the session is currently executing in the Active Transactions panel:
NOTE: For the client statement cache to be presented in ProTop, the session holding the transaction has to be making round trips to the database in order to get the request to share and then to send the cache. - If the statement cache is not visible, you can use the PID and Device details to log into the server the session is running on and then as either the process owner or as root, issue a proGetStack [PID]. You should find the protrace.[PID] file in the session's working directory.
OPTION 2: zOldTRXDetails.shx (Linux/UNIX only)
Recent versions of ProTop for *nix include the script bin/zOldTRXDetails.shx. This logic can produce and add a stack trace (protrace) for the old transaction session to the information passed to the portal by the an "otrx" alert.
To use this approach, first copy bin/zOldTRXDetails.shx to bin/zOldTRXDetails.sh. Then verify your otrx alert definition includes the zOldTRXDetails enhancer as seen here:
otrx   num  >       7200  "" "hourly" "Old Transaction &1 &2 &3" zOldTRXDetails,alarm
otrx   num  >       3600  "" "hourly" "Old Transaction &1 &2 &3" zOldTRXDetails,alert
By default ProTop will look for protrace files in the user's home directory as defined in /etc/passwd or in the $PROTRACE directory defined in bin/localenv (/home if not set).
ProTop must be run by an ID that has sudo access and therefore allowed to run kill -USR1 on processes other that it's own. See the script for more details.
See also
Clear Client Statement Cache (_)
If all else fails...
Contact us at support@wss.com or use the online chat. We'll be happy to help.