
Install ProTop on Unix/Linux
If you're installing ProTop for the first time, read the installation requirements.
Reminder: Set your terminal window to 160 columns by 48 lines.

1. Download ProTop to your desktop from wss.com or your local ProTop web portal (see the Intro Page)
2. Log in to the server that will run ProTop. ProTop must be installed on the same server as the databases it monitors. We advise strongly against using the root user for any OpenEdge processes, including ProTop
3. Set up your Progress environment variables. You can do this manually by setting DLC to the OpenEdge installation directory or automatically by running the proenv script available in $DLC/bin
4. Create the ProTop installation directory, for example, "/opt/protop"
5. Change directories to the ProTop installation directory
6. Transfer the downloaded ProTop installation file from your desktop to the ProTop installation directory on the server
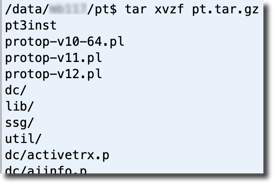
7. Uncompress and extract the downloaded tar.gz file directly in this directory:
$ tar xvzf pt.tar.gz
Example:
8. Launch pt3inst. If the OS environment variable $DLC is not set, you will be prompted to enter the full path to your OpenEdge installation directory
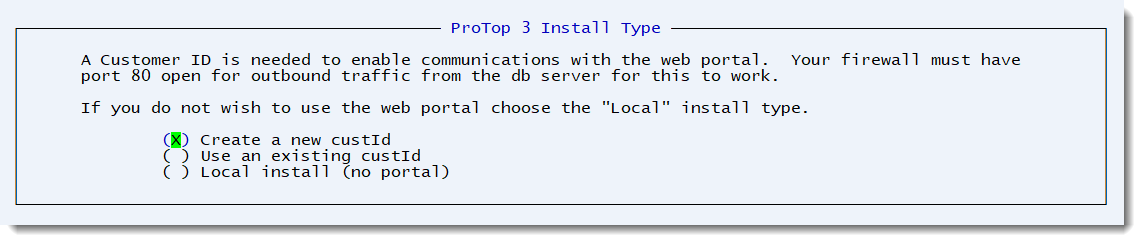
9. Select the installation type by using the up/down arrow keys to highlight the correct line, then spacebar to select the highlighted option
- If this is your first time installing ProTop you wish to trend data on our web portal, select "Create a new custId"
- If you already have an account on the web portal and are reinstalling ProTop, or installing ProTop on a new server, select "Use an existing custId" and enter it on the next screen
- If you prefer to only use the locally-installed Real-Time Monitor and not send data to the web portal, select "Local install (no portal)"
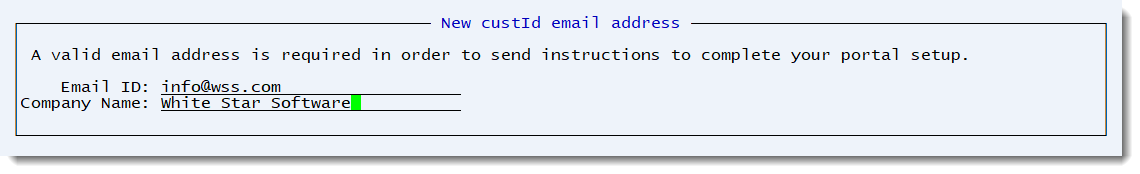
10. If you selected "Create a new custId" in the previous step, you will be prompted to enter an email address and company name. Your new ProTop web portal login credentials will be sent to this email address
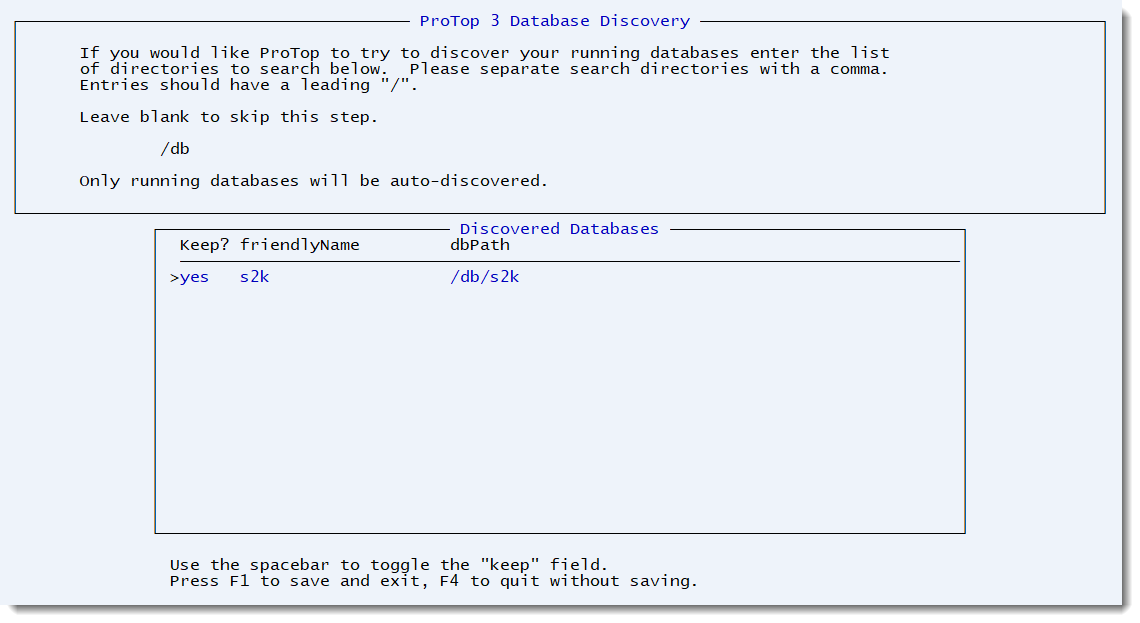
11. Enter a comma-separated list of directories containing databases you wish ProTop to discover or leave blank to skip this step. Only running databases will be auto-discovered

12. Select the databases you want ProTop to monitor
- Use the Up/Down arrows to scroll through the list
- Space Bar to toggle the Keep value
- To exit the automatic database discovery process:
- Use F1 or Ctrl-x to save monitored databases and exit
- Use F4 to quit without saving databases
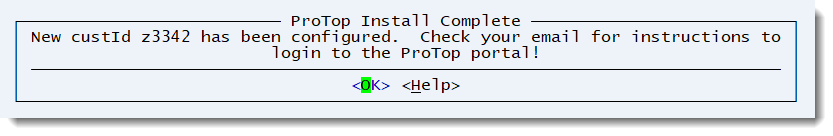
If you selected "Create a new custId" as the installation type, your new custId will be displayed in a confirmation message
If you selected "Local install (no portal) as the installation type, please proceed to the Starting ProTop Real-Time help page to get started.
Web Portal Trend Data Configuration
Now that you have installed the basic ProTop package, please perform the following configuration steps to gather your metrics and send them to the ProTop Portal for trending and graphic presentation.
If you need to use SSL between your ProTop installation and the ProTop Portal, see SSL / Secure Socket Layer for ProTop before proceeding.
13. [OPTIONAL] Source the ProTop environment script protopenv to correctly set all OpenEdge and ProTop environment variables. If you skip this step, please replace "$PROTOP" with the full path to the ProTop directory in the examples below. Note the dot space at the beginning of the command line:
$ . /data/protop/bin/protopenv
14. Add the ProTop DB Monitor task to the crontab of any user. We suggest selecting whichever user owns the database files and starts the databases. While we often see root being used in this role, this is not considered best practice.
There is an example in $PROTOP/etc/crontab.pt3:
0,15,30,45 * * * * /data/protop/bin/dbmonitor.sh >> /data/protop/log/dbmonitor.cron.log 2>&1
15. Verify the ProTop DB Monitor task is running:
$ ps -ef | grep dbmonitor

16. If you do not see the DB Monitor running, you can manually execute the command you added to your crontab:
/data/protop/bin/dbmonitor.sh
or wait until the cron daemon starts the DB Monitor process
17. If you did not configure any databases or wish to add more, see Adding More Databases for detailed instructions
18. One or two minutes after DB Monitor starts, you should see one pt3agent process running per configured database. You can verify this by checking for the existence of pt3agent processes:
$ ps -ef | grep pt3agent

Each agent is sending metric data to the web portal for its associated database
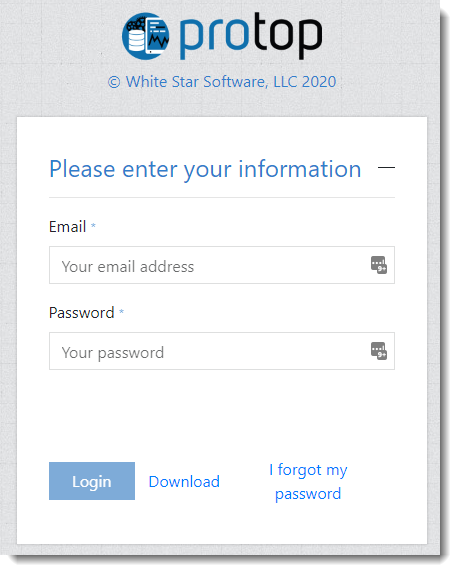
Access the Portal
19. Check your email. By now, you should have received an email with your login credentials and the URL of your ProTop web portal. (No we do not use "password" as the default password!)

20. Click on the link in the email to login to the ProTop web portal
You will start seeing data in the web portal in about 5-10 minutes.
Problems?
If you are not seeing data in the portal, or if you have any problems or questions, there are multiple ways for you to get help:
Our Troubleshooting Guide covers the most common issues such as proxies and firewalls
The ProTop Community is a great place to ask questions about how to use ProTop and how to interpret the data
Of course, you can send us an email at any time and we'll do our best to respond within one business day