If ProTop is not installed, click here for the installation guide.
For UNIX-based systems
- Login to the server and change directories to the ProTop installation directory ($PROTOP).
-
Run bin/protop with one argument. That argument should either be
- A friendly name listed in etc/dblist.cfg. Example: bin/protop friendlyname
- The full path and database name. Example: bin/protop /path/to/db/dbname
- Alternatively, starting in ProTop 328, run 'bin/protop' with no arguments. You will be presented with a list of available resources for this site. Move the cursor up and down with your arrow keys and press Enter to select the resource you want to run ProTop RT against:

For Windows-based systems
On Windows, there are two options:
- Log onto the Windows box that has ProTop installed
- Open a proenv window
-
Either run bin\protop with one argument. That argument should either be:
- A friendly name listed in etc\dblist.cfg. Example: bin\protop friendlyname
- The full path and database name. Example: bin\protop \path\to\db\dbname
- Or, run ProTop from the Windows desktop icon. If you do not have an icon, create one using the instructions below.
- Alternatively, starting in ProTop Version 328, run ' bin\protop' with no arguments. You will see a list of available resources for this site. Move the cursor up and down with your arrow keys and press Enter to select the resource you want to run ProTop RT against:
Use F4 or q to quit the menu.
Or, create a Windows desktop shortcut
-
- Open Windows File Explorer to the ProTop installation directory (%PROTOP%), then to the bin subdirectory
- Double-click on mkscut.bat. This will create a desktop shortcut for ProTop

- Right-click the newly created icon and select "Rename" to give the shortcut a more meaningful name
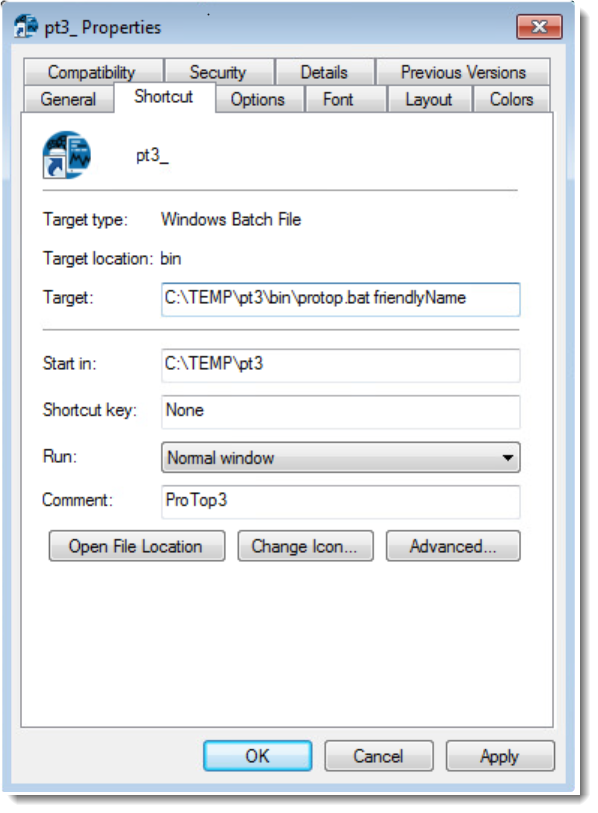
- Right-click again and select "Properties"
- Select the "Shortcut" tab
- Add the friendly name or full DB path to the end of the "Target:"
- Click on "OK"
- Test by double-clicking the shortcut


Ok, I've got it started; what's next?
Have a look at these ProTop Help Pages to learn about ProTop RT's functionality:
Set up your ProTop environment
This allows you to run ProTop commands like "protop friendlyName" without having to be in the bin directory:
- log in to the server that has ProTop installed
- cd to your ProTop installation bin directory
- for Linux run: . protopenv (that's a period followed by protopenv, which will set the environment variables in the current shell)
- for Windows run: protopenv