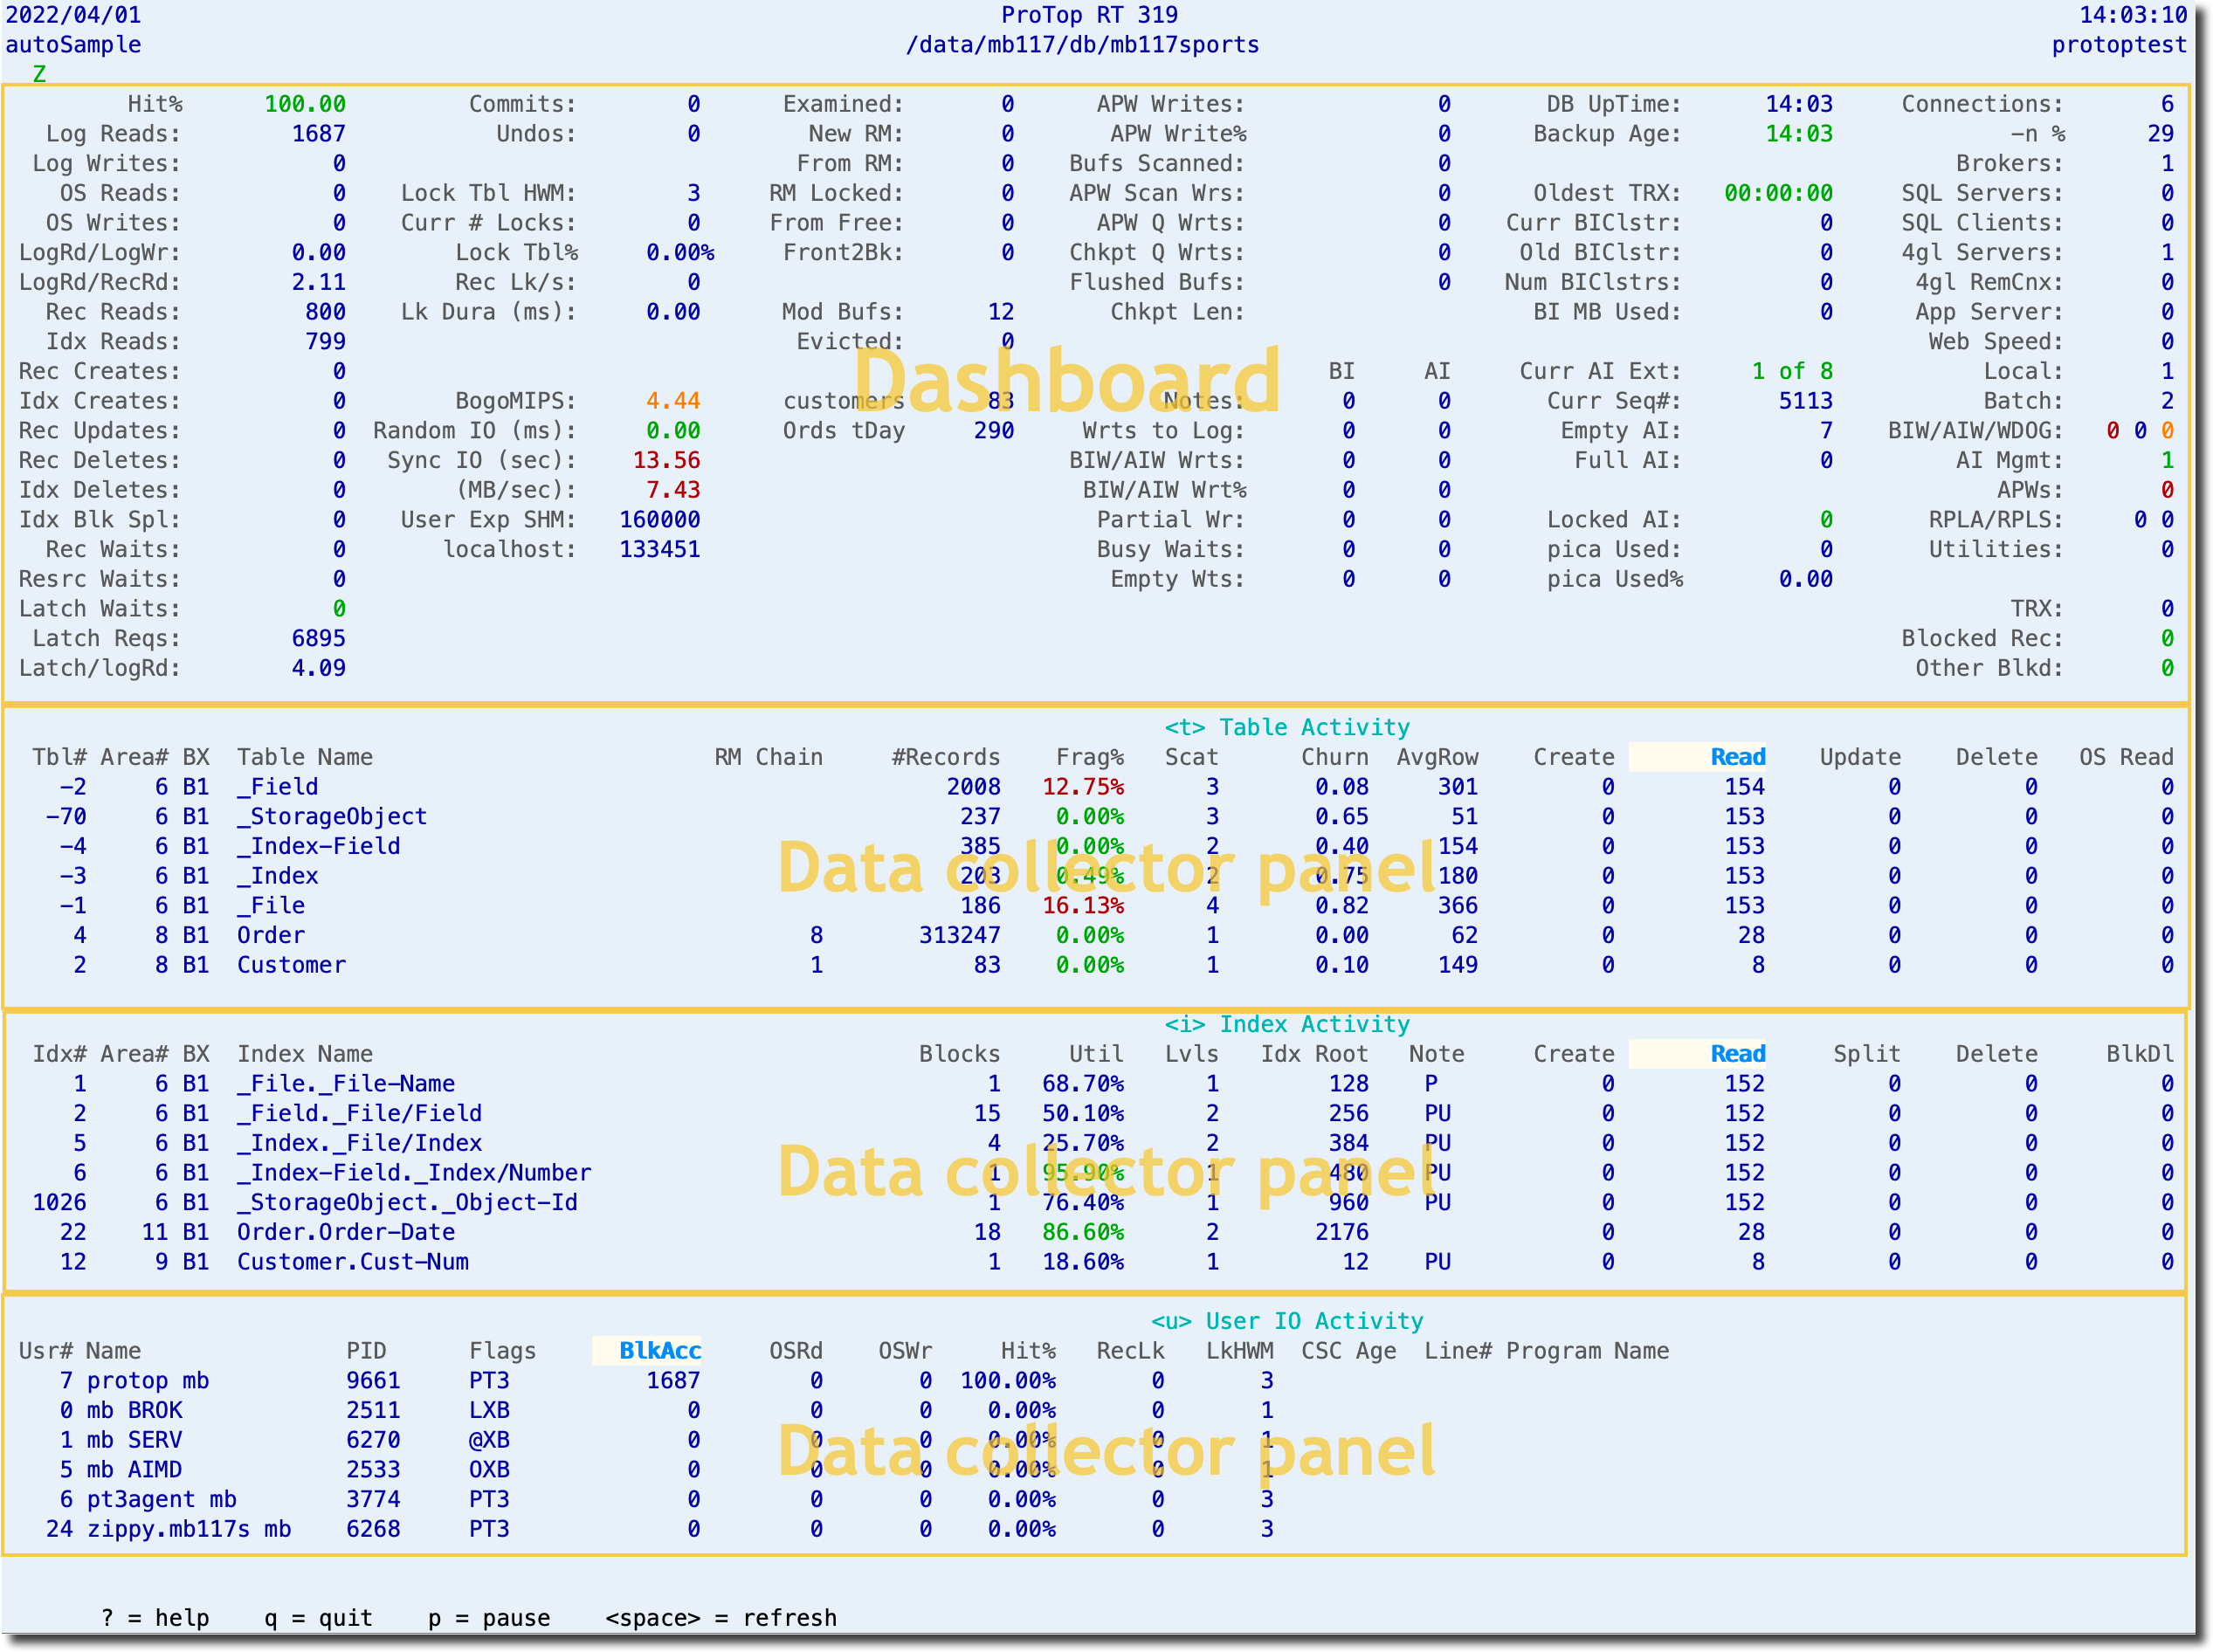
ProTop RT - Initial View
The ProTop Real-Time monitor can be thought of as a tower of lego blocks: you can add and remove sections as you see fit.
NOTE: If you are starting ProTop in a window containing fewer than 160 columns, you will be presented with the ProTop Core interface instead of the normal ProTop interface described below.
At startup, ProTop displays the Performance Dashboard <d> data collector at the top and the Table Activity, Index Activity, and User IO Activity data collector panels below by default.
- Each data collector panel is described on its own help page.
- The complete list of data collectors is found here.
- Links to the panel details are found here.
- To see the current list of available panels in ProTop RT, use the "?" or "h" command keys to display the ProTop Help screen.
The contents of the title bar (top 3 lines) are explained below.

The left side of the title bar:
| Top | Date |
| Middle | Sampling State (use "$" to switch to On-Demand sampling) |
| Bottom |
Last Keystroke accepted ("u" in black above) Keystroke History (in green) Green history means ProTop RT is accepting keystrokes, red means processing. How long RT waits for keystrokes is controlled in etc/protop.cfg by the realTimeMinDelay parameter. |
The center of the title bar:
| Top | ProTop Version |
| Bottom | Connected Database |
The right side of the title bar:
| Top | Time |
| Bottom | Server Name |
Command Key Hints
Notice the characters between "<" and ">" in the image below:

These are the command keys used to show and hide that data collector panel. At times, you will need to free up screen real estate to display other metrics. Use the command key shown <*>) to the left of the data collector panel name to hide that panel and free up space.
The bottom line
The very bottom line of the screen is a menu of basic ProTop RT commands:
- ? = help - Brings up the ProTop help screen which shows the available command keys.
- q = quit - The proper way to exit ProTop RT.
- p = pause - Stop auto sampling for a screenshot.
- <space> = refresh - Forces a new sample to be taken (or unpauses <p>)


