See the Alerts Quick Reference for the nearly 1000 alertable metrics available in ProTop. NOTE: Not all Metric Names make sense to alert on. For more information on alerting, click the Questions?Comments? link at the top right of this page or the chat icon at the bottom left.
What is a ProTop alert?
At its most basic, a ProTop alert is a message sent by a ProTop agent at the client site to the ProTop Portal when certain criteria are met. In the commercial version of ProTop, if the portal contains an Alert Response definition for this site and type of alert, the portal will send the message to you and/or your designated recipients or systems, indicating a defined threshold has been crossed. This could be a message for information purposes only, a warning, an alarm, or a "page" event that requires immediate attention.
At a more advanced level, alerts can be defined to execute a script, gather more time-critical details (enhancers) before sending the message to the portal, filter for specific values, and or execute according to a schedule.
How do ProTop alerts work?
- It all starts with the DB Monitor service (*nix cron job or the Windows Service created at install), ensuring the monitoring agents are up and running. If they are not running, the portal will issue heartbeat alerts to this effect.
- When the agent starts, it reads the list of data collectors listed in the ptInitDC variable found in etc/pt3agent.*.cfg and runs those procedures, which gather the current metric values used to compare with the thresholds defined.
- At each monitoring interval (monInt defined in pt3agent.*.cfg), the agent reads the alert definitions in etc/alert.*.cfg (preferably your localized version).
- Compares the metric's current value to the threshold in the alert definition.
- If the alert threshold is breached, the agent creates a message to this effect.
- Performs the listed actions in the order they appear,
- All according to the given sensitivity and nag frequency.
- The message is sent to the portal when the Action list includes the word info, alert, alarm, or page.
- The alert appears in the Alerts Dashboard on the portal:
- The alert is then handled according to the Alert Responses defined in the portal for the site.
- This often results in email or page messages containing the alert details sent to a list of recipients.
What are the parameters of a ProTop alert?
The alert definition template exists at the top of your etc/alert.*.cfg file:
# alert.cfg (Note: the first line in this file must be a comment, no blank lines allowed!)
#
# Configure ProTop Alerts
#
# Metric Type Compare Target Sensitivity Notify Message              Action
# ====== ==== ======= ====== =========== ====== ==================== =======================
# LogRd   num       > 100000         3:5 Always "Hit Ratio &1 &2 &3" alert-message,alert-log
#
# Metric        The name of the field being monitored (generally temp table field names in dc/*.p).
#
# Type          Data type -- char or num (string or numeric).
#
# Compare       Operator  -- >, <, =, <>, <=, >=
#
# Target        The threshold value of the metric to be tested.
#
# Sensitivity   How sensitive to be -- blank means always
#                   # = after # or more occurences
#                   #:# = after # or more occurences over # samples
#
# Notify        How often to notify (aka "nag level") -- blank means always
#                   always = 0
#                   daily = 86400
#                   hourly = 3600
#                   # = frequency in seconds
#
# Message       Message text:
#                   &1 = current value
#                   &2 = comparison operator
#                   &3 = target
#                   &4 = sensitivity
#                   &5 = notify
#
# Action        Comma delimited list of events which will be PUBLISHed with
#               message as a parameter.  Current event types are:
#                   z*            - adds information to the body of the alert
#                   alert         - "this is something interesting"
#                   alarm         - "you should act on this soon"
#                   page          - "a bad thing is happening, act immediately"
#                   script        - executes $PROTOP/bin/metricName
For example, review this default entry from etc/alert.cfg:
HR num < 98 "3:3" "hourly" "Hit ratio &2 &3 (&1)" alarm
According to the alert definition template above, this says: If the current value of the alertable Metric HR (buffer hit rate percent), a number, is less than 98 for three occurrences over three samples, then once per hour, send the message "Hit ratio < 98 (95)" (95 is the current value of HR), as an alarm, to the portal. The message will appear in the Alerts Dashboard on the portal, highlighted in orange. And, assuming the administrator has an Alert Response defined for alarms for this site, the alarm message will be emailed to the listed recipients.
Before adding alert definitions: is it already there?
NOTE: ProTop comes configured with a wide variety of alert definitions by default and includes many of the most interesting metrics. Be sure to first check if the metric you want is already defined in etc/alert.*.cfg, it just might be.
Alert definitions out of the box: Uncommented
If the metric you want is in etc/alert.*.cfg and it is not commented out (no # at the beginning of the line), great, look for occurrences of the alert on the portal. You can use it as is or edit and tweak the parameters above as you see fit to dial in the level of sensitivity you require. If you change the file, save it, and the agent will pick up the changes shortly.
Alert definitions out of the box: Commented
If the metric you are interested in has an alert defined in etc/alert.*.cfg but is commented out, configure the parameters above to your liking, remove the # at the beginning of the line, and save the file. The agent will pick up the change shortly.
Is the data collector running?
The data collector for your (uncommented) metric might not be included in the ptInitDC variable defined in your etc/pt3agent.*.cfg file by default. If this is the case, the alert definition will not fire. To remedy this, add the needed data collector to ptInitDC.
If you do not already know your data collector name, use the search box at the top of this page to find articles that reference the metric you are interested in. Select the "Data Collector" article that appears. Note the name of the data collector found in quotes at the top of the article.
Edit your etc/pt3agent.*.cfg file and search for the data collector name. It should appear in the comma-separated list of data collector names defined in the ptInitDC variable. If it is not there, add it (names are case-sensitive), save the file, and restart the agent.
If you have more than one custom pt3agent configuration file in your ProTop installation, ensure you add the data collector to the correct (most restrictive to that resource) pt3agent configuration file. For instance, if you are adding an enhancer to an alert for your "sports" database, and you have a pt3agent config file for your site, like pt3agent.z8331.cfg as well as a pt3agent for your sports database, pt3agent.sports.cfg, be sure to add the data collector name to pt3agent.sports.cfg as the pt3agent for the site is ignored. (See the ProTop File Naming Hierarchy for more information).
To restart this agent only, cd to [PROTOPDIR]/tmp and find the *.flg file with the same name as the etc/pt3agent.*.cfg file you just edited and remove it. The DB Monitor will restart the agent shortly.
How to create a new alert definition
If you are sure the metric you are interested in is not already defined in your etc/alert.*.cfg file as detailed above, then you'll need to create a new alert definition.
- Find the alertable metric you are interested in creating an alert for, its data type, and the name of the data collector that monitors it. If you do not know this information, start with the Alertable Metrics Overview page.
- Add the alert parameters (above) for the metric of interest to your alert configuration file. Restarting anything is unnecessary as the agent reads this file regularly. Consider scanning your etc/alert.*.cfg file for a definition similar to the one you want to define. Copy and paste that as the base for your new definition, then adjust it as necessary.
- Verify your data collector. See "Is the data collector running?" above.
- If you added a data collector to the ptInitDC variable, restart the agent by removing the pt3agent.[friendlyname].flg that corresponds with the resource for which you are creating the alert. The database monitor will restart the agent shortly.
Alert Enhancers
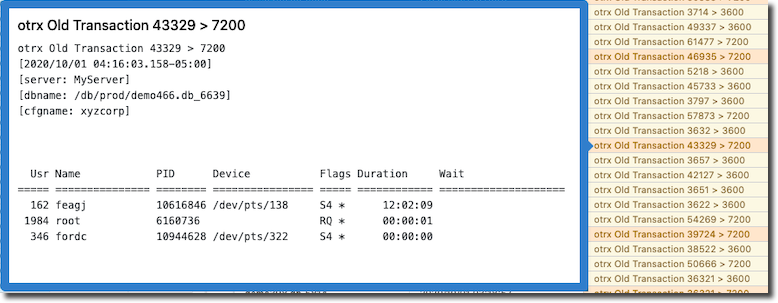
Here is an alarm (in orange on the right), as seen in the ProTop Portal Dashboard Alerts window. Notice details at the bottom of the box that pops up when you hover your cursor over the alert:
This is the alert definition in etc/alert.*.cfg that produced the alarms seen in orange in the image above:
otrx num > 7200 "" "hourly" "Old Transaction &1 &2 &3" zOldTRXDetails,alarm
This alert includes an Alert Enhancer, zOldTRXDetails, which provides the additional detail seen at the bottom of the blue box. The enhancer is executed and added to the Alert message body before the alarm is sent to the portal. Learn a lot more about alert enhancers below.
Alert enhancers: more detail, please!
Alert enhancers gather important context information for your alerts so you don't have to. This detail is added to the body of a message before something like "alarm" or "page" sends it off to the user. The list can have as many parts as makes sense.
Take this alert definition in etc/alert.yourCustId.cfg:
resrcWts num > 500 "" "hourly" "&1 &2 &3" alert
Once an hour, this will send an alert to the portal when the alertable metric resrcWts (resource waits) exceeds 500. If resrcWts reaches, say, 514, the alert message in the portal will read "resrcWts 514 > 500". This is enough to kick off an investigation, but critical details may have been lost when we notice the alert and pull up ProTop RT to look into the matter.
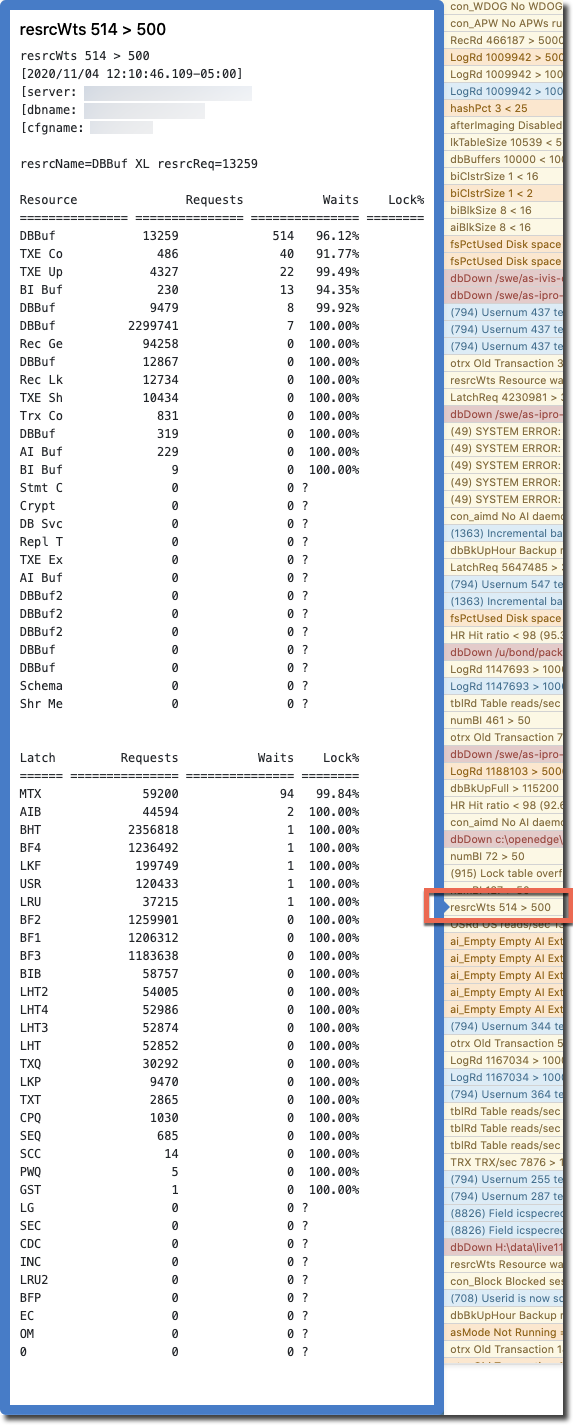
If we edit the alert definition and add Alert Enhancers, let's say, Resource Details (zResourceDetails) and Latch Details (zLatchDetails) to the actions list, the new definition looks like this:
resrcWts num > 500 "" "hourly" "&1 &2 &3" zResourceDetails,zLatchDetails,alert
In that order, the Resource and Latch details will be added to the Alert message body before the action "alert" is sent to the portal. You will now see the busiest Resources and Latches and the extent to which each was in use at the time the alert was triggered, getting you closer to the root cause faster than you would be without the enhancers.
NOTE: As for alert definitions, for alert enhancers to work the associated data collector must be included in the pt3agent configuration file used by that resource. See the section above on data collectors for more information.
LIKEWISE: Alert enhancers must be added to the alert config file being used by your resource. If you have more than one alert config file, be sure to change the one that applies to the resource you are interested it.
For example, if you are adding enhancers to an alert for your sports database and you have alert.sports.cfg as well as alert.<custId>.cfg, add it to the alert.sports.cfg. The pt3agent for that database will not read alert.<custid>.cfg as the alert.sports.cfg takes precedence.
Again, you can add as many enhancers to your alert definition as makes sense. They will be executed in the order in which they appear in the comma-separated list of items in the action section of the alert definition.
Here is an example of the alert above, as seen in the ProTop Portal Dashboard. The blue box pops up when you hover your cursor over the Alert Message in the Alerts window (red box in the image below). This shows the Alert Message "resrcWts 514 > 500" enhanced with Resource Details and Latch Details:
Available Alert Enhancers
| Alert Enhancer | Useful For | Shows | ProTop RT Panel | Alertable Metrics |
| zOldTRXDetails | Issues regarding old transactions, excessive use of BI | User Number, User Name, PID, Device, Flags, Duration, Idle Time, and Wait Time; it also fires bin/zOldTRXDetails.sh, if it exists, and output is fed to the next action in the alert action list; see bin/zOldTRXDetails.shx for an example | Active Transactions (x) | Active Transactions |
| zDirtySchema | Identifying which schema currently live in the schema area so they can be moved to a more appropriate area | Object Number, Type, and Name | ||
| zHashPct | Tuning Database Buffers and Hash Table Entries | -hash, -B, -B2, and -hash as a percent of the database buffer pool | Configuration Startup (c) | Configuration (Startup) |
| zBlockedDetails | Troubleshooting Locking Conflicts | For the "blocked" user, User Number, User Name, PID, Flags, Duration, Wait, Resource ID, Table Name | Blocked (b) | Blocked Sessions |
| zBlockerDetails | Troubleshooting Locking Conflicts | For the "blocker", User Number, User Name, PID, Flags, Duration, Wait, Resource ID, Table Name Used with zBlockedDetails above | Blocked (b) | Blocked Sessions |
| zLatchDetails | Troubleshooting Latch contention | Latch Name, Number of Requests for that Latch, Number of Waits for that Latch, and Lock % | Latch Activity (w) | Latch Activity |
| zUserLocks | Identifying users with the highest numbers of record locks to get at the code they are running | User Number, User Name, PID, Flags, Logical Reads, Record Locks, Locks High Water Mark, Line Number in code they are running and the name of the procedure they are running (requires client statement cache be enabled for suspect users) | User IO Activity (u) | User IO Activity |
| zUserLkHWM | Similar to zUserLocks above but in presented in order by the high water mark | |||
| zUserActivity | Silimar to zUserLocks and zUserLkHWM | |||
| zRecordActivity (not zTableActivity) | Investigating Table Usage | Table Number, Table Name, Number of Records in the Table, Number of Creates, Reads, Updates, and Deletes plus Churn (Ratio of Reads to Records in the Table) | Table Activity (t) | Table Activity |
| zResourceDetails | Troubleshooting Database Internal Resource contention | Resource Name, Number of Requests for that Resource, Number of Waits for that Resource, and Lock % | Latch Activity (w) | Resource Activity |
| zIndexActivity | Investigating Index Usage | Index Number, Index Name, Number of Index Blocks for the Index, Number of Index Creates, Reads, Splits, Deletes, and Block Level Index Deletes | Index Activity (i) | Index Activity |
| zAppNote | Providing Application Specific Context | As defined by the user when configuring Application Monitoring | Application Specific (e) | Application Specific |
| zlog2rec | Investigating High OS Read Activity Reported by the Database | Logical Reads, Record Reads, Logical Read Threshold and indicates if a Backup is running | Dashboard (d) | Dashboard |
Alert Actions
The next section of arguments in an entry in the alert.yourCustId.cfg tells the portal which comma-separated action(s), listed in order from left to right, to perform when this alert arrives. For example, if you want to see the output of the Enhancer and/or the script in the details of the info/warning/alarm/page, make sure that the info/warning/alarm/page is last in the list.
| Action | Meaning |
| info | seen in the Dashboard Alerts window in blue |
| alert | seen in the Dashboard Alerts window in yellow (aka warning) |
| alarm | seen in the Dashboard Alerts window in orange |
| page | seen in the Dashboard Alerts window in red; also sends out paging events as configured in the portal |
| script | in addition to the above alerts, if the word script is included, a script named the same as the alertable metric (no extension on *nix; .cmd or .bat on Windows), if found in the ProTop bin directory, will be executed |
| enhancers | see above |
Alert Filters
Want to add a bit of secondary logic before an alert is sent to the portal? ProTop allows you to alert differently based on the name of an instance of the thing. Check out this article to learn how to Filter your alerts.
How changing an alert definition affects alert timing
The countdown to the following alert for a given definition starts the first time its metric threshold is breached. If you have an existing breach, you will get an alert immediately upon restarting the ProTop agent, and then the countdown to the following alert for that metric breach begins.
The ProTop agent re-loads the alert definitions when it is restarted. It also occurs every monInt seconds if the alert.*.cfg file has changed. When the agent loads new or changed definitions, existing definitions and running countdowns to the next alert are unaffected. If you remove or comment out an alert, that alert will no longer fire.
Monitoring Interval - monInt
The variable monInt, a value in seconds, is set in etc/pt3agent.*.cfg, the default is 300. The minimum is 30 seconds and the max is 900. Values outside this range will be ignored and the default 300 will be used.
Despite the monitoring interval, ProTop always collects ALL metrics and if monInt seconds have passed, it pauses one tenth of a second and then collects again, at most once in 30 seconds (the minimum interval).
Alert Scheduling
It is possible within ProTop Alerting to restrict alerts to fire within a given timeframe. In general, you define a schedule in your alert configuration file and list below that schedule the alert definitions you want to be active in that window. You can define multiple schedules in the same manner. Only the alerts after the current schedule line and before the next schedule are affected by that schedule.
For example, to limit an alert for excessive table reads to fire only on weekdays during business hours, follow these steps:
1. Start by adding this block of code to the bottom of your alert.*.cfg file:
### scheduled alerts
#
# Schedule lines apply to all alerts up to the next schedule line
#
# If there is no "schedule" line then alerts default to "always"
#
#       schedule  weekday-list monthday-list start-time end-time
#       ========  ============ ============= ========== ========
#       schedule     2,3,4,5,6             *       6:00    18:00
#
# Weekday-List is a comma delimited list of weekday numbers where Sunday = 1
# weekday-List and monthday-list are currently ignored
# Start-time is the time to begin applying alerts in hh:mm:ss format
# End-time is the time to stop applying alerts in hh:mm:ss format
#

schedule 2,3,4,5,6 * 8:00 18:00

tblRd   num  > 100000 "" "hourly" "Reads exceeding 100k/sec &1 &2 &3" alert

#schedule 2,3,4,5,6 * 8:00 17:00

#tblRd   num  > 200 "" "60" "alert filter test &1 &2 &3" alert "tblName = _Field"
2. Find the similar alert definition that exists above this one and comment it out.
3. Save the file.
The pt3agent will re-read this alert configuration file at the next monitor interval (monInt) as defined in pt3agent.*.cfg.
This schedule says if it is Monday, Tuesday, Wednesday, Thursday, or Friday, and day of the month, between 8 AM and 6 PM only, execute the alert definitions that follow, up to the next schedule line (if any).
CAVEAT: As highlighted in the commented code block above, the day of the week and day of the month are currently ignored. There is a fix in the works. This feature is however still good for placing a daily timeframe outside of which you will not be getting alerts from this definition (like 3 AM when you know you have large reports running).